


I’ve mentioned it before, but I’m a runner. Among the number of hats I wear on a daily basis, my runner hat remains a difficult hat to claim. Nevertheless, I have regular running days, a running partner, and organized race registrations looming in the future.
A few years ago, as I trained for another half-marathon I swore I wasn’t going to do. I started using a journal to document my training. Every day I wrote at least two things:
- How far I ran
- How I felt while I did it
I tracked that effort for four months and then set the journal down.
Last week, as I cleaned out a closet, I discovered that journal. I opened it up and flipped through the pages. Immediately, I remembered those rainy days in January, what it was like to wake up in the dark and the cold, lace up my shoes, and hit the pavement. I also found the first day of an ankle injury that still flares up on me from time to time. I documented each day the pain persisted and marked the day I ran pain-free with five exclamation marks.
At the time, the daily ritual was a way to hold myself accountable to the training plan. Looking at those data now, I read them like a story about the hard work it took to get over that finish line inside the University of Oregon's historic Hayward Field.
Your PBIS data tell stories, too, and sharing those stories with your larger schoolwide community is an essential element of your PBIS implementation.
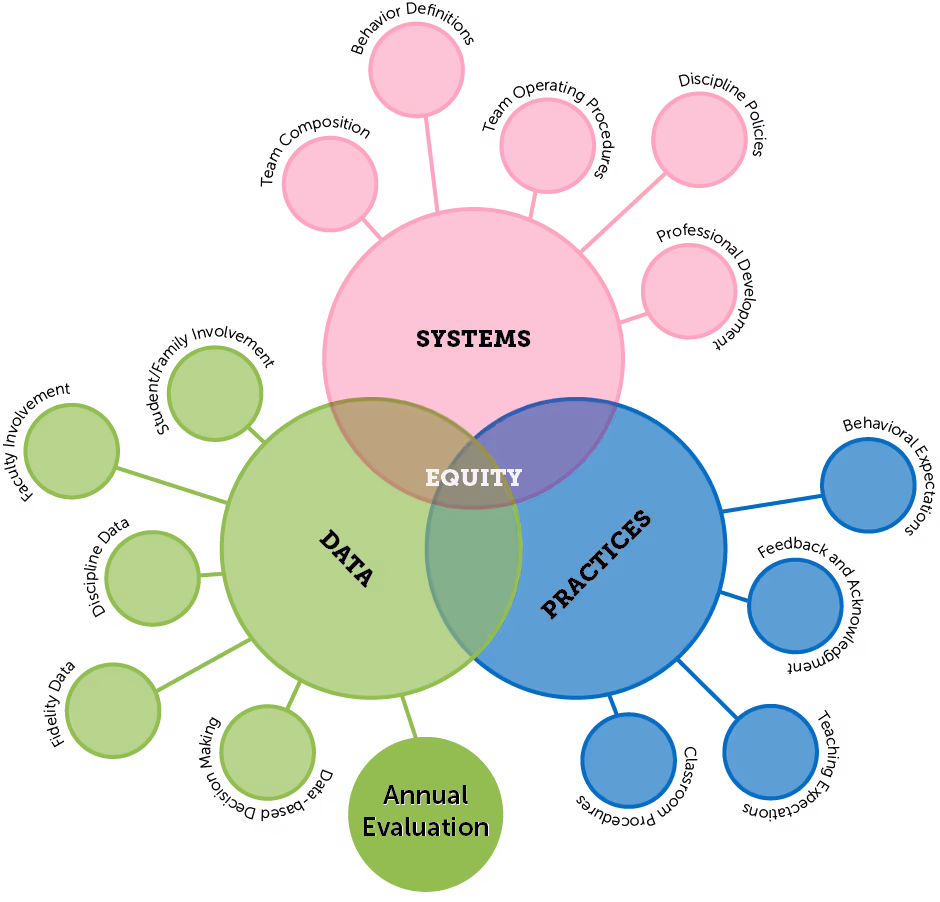
There are three essential elements to PBIS:
- Systems: the policies, procedures, processes, and priorities to keep your efforts going over the long haul.
- Practices: the evidence-based, culturally-relevant things you DO WITH your students.
- Data: the information to help you choose your next steps, evaluate how things have been going, and sound the alarm when something needs to change.
The framework also has 15 features that fit neatly into these three elements with equity at the center binding them all together. As a diagram, it looks like this:

The Tiered Fidelity Inventory (TFI) helps us evaluate the fidelity of our implementation efforts and answer the question: Are we doing what we said we would do? According to that survey, every school implementing a PBIS framework must complete an annual evaluation about what they did, the outcomes they achieved, and how those efforts compare to previous years. Oh, and here’s the critical part: You have to share that evaluation with your larger schoolwide community.
Here's why that's so important.
Researchers wondered which things schools do that make it more likely they will sustain their PBIS implementation.1 It turns out, sharing data was a key practice. “By sharing data frequently with school staff, the school team may…strengthen perceptions that implementation leads to valued outcomes.”
When everyone understands the goal and sees the progress, they’re more likely to embrace the systems and practices you implement. PBIS becomes more than a framework; it's how you do school.
You could slap your SWIS data in an email to staff and families and call it a day. Or, you could take the opportunity to tell the tale of your PBIS implementation through good old-fashioned data storytelling.
What’s a Data Story
According to Harvard Business School, data storytelling is “the ability to effectively communicate insights from a dataset using narratives and visualizations. It can be used to put data insights into context for and inspire action from your audience.”2 This definition is a good place to start, but don’t you want to know HOW to tell a good data story?
Me too.
It turns out, data storytelling has its own framework. The visual for that framework involves a Venn diagram of three overlapping circles. Sound familiar?
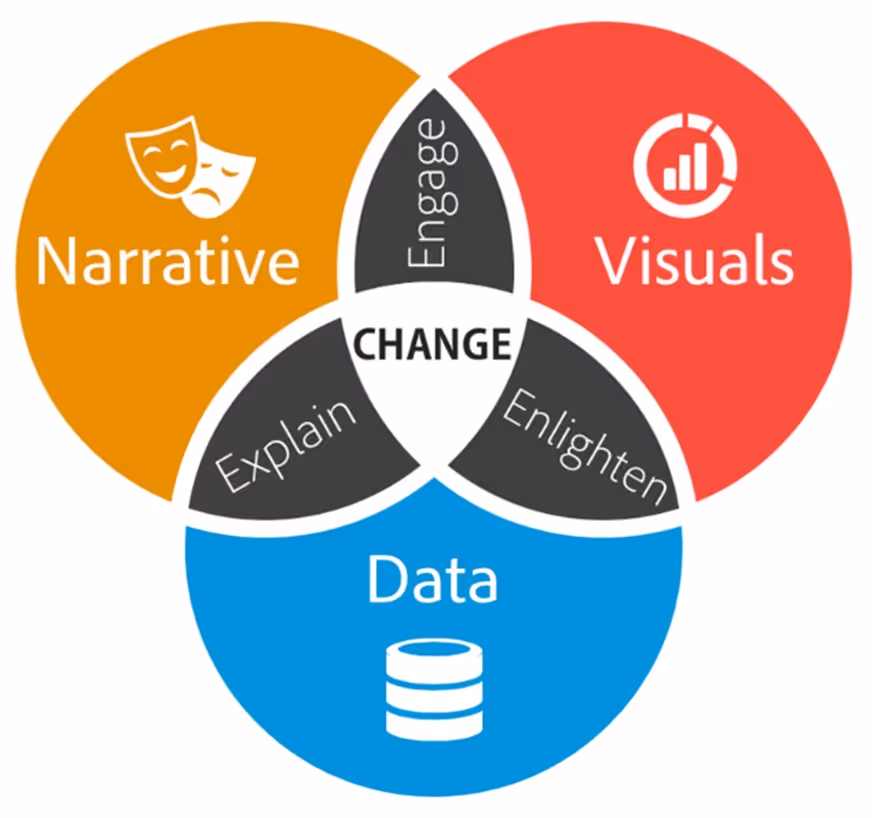
There are three essential elements to a data story.3
- Data: The foundation upon which you build your story.
- Visuals: A graphic representation of the data.
- Narrative: The insights, context, and actions you get from analyzing the data.
It’s possible to share two out of the three elements. When you do, you convey a message that either engages, enlightens, or explains, but never all three. When your story includes the narrative, visuals, and data that’s the sweet spot where your storytelling inspires change.
Throughout the school year, you’ve uncovered important insights in your data and acted on them. It’s time to communicate those stories to everyone else. Your school’s annual PBIS evaluation is the perfect opportunity to share those data stories with students, families, and staff, fill them in on the work you’ve accomplished, and highlight how they helped achieve those outcomes with you.
Here are some ideas to consider as you use your annual evaluation to tell a data story.
Start at the Beginning
While some stories start in the middle, this is a time where your story works best from the beginning. A good data story sets the stage with an overall view of how things are going. This is a good place to share graphs like:
- Average Referrals per Day per Month from SWIS
- TFI Total Score and Scale Reports from PBIS Assessment
- Triangle Data Report from the SWIS Year-end Report
This is also a good place to think about the supplemental data you can add to these graphs to highlight what you want folks to understand. What story would you tell if you shared a multi-year version of the Average Referrals per Day per Month graph? How would that story change if you compared your current year's averages with the national averages for schools of similar size. How do your behavior trends match with your TFI scores? Think about the overall story you want to tell your schoolwide community, then use your data and visuals to support it.
Share What Made You Curious
At some point in the year, something in your data caught your attention and made you curious to know more. In a traditional story arc, we’d call this moment the “inciting incident” — the moment near the beginning of a story that sets things moving in a specific direction.
Think about that incident for your team — a moment where you noticed a pattern or an outlier and decided to focus your attention on solving it. Tell your audience why the data piqued your curiosity. Bring them along in your process. For example, let’s say this was our school’s Referrals by Behavior graph.

The inclination might have been to focus on Defiance and Inappropriate Language. This team focused on Tardy because of what they knew about their school. They knew staff were talking about students coming late to class and their data backed up those experiences. In this section of the annual evaluation, sharing this story would let everyone know how the team used what they know about their school to prioritize their data-driven decisions.
Add Your Audience to the Story
There’s been a lot of data so far. It’s time to add your reader as a character in the story. Share the practices you implemented and the systems you modified to find a solution to the problem. It’s the perfect time to highlight the ways your schoolwide community participated. PBIS implementation is a team effort. Even though they might not sit around that monthly table with you looking at data and making decisions, the improved outcomes you want are only possible when everyone works together. Remind them how students, staff, and families worked together this year.

Nail the Punchline
You built the tension. Your audience wants to know what happened. It’s time to show those outcomes! All school year, your team used data to drive decisions. You also used data to monitor progress. We know what the data looked like before, so show them what everyone’s efforts achieved.
At this point in our example story, the team gets to share there were 30% fewer referrals for tardy in the second half of the year than during the first part of the year! Even though they weren’t able to meet their goal of a 50% reduction, they can make a plan to continue their progress next year.
Tell Them What Comes Next
The good news about your data story is there will always be a sequel. Your work doesn’t end with the school year. You’ll pick things right up in August. Use the end of this data story to tell them what comes next.
Make an action plan of what you want to do at the beginning of the year and share it with your audience. Will you have professional development opportunities? Will you continue with the practices you put in place at the end of the year? What should they expect from you at the beginning of the year?
Don’t leave your audience in suspense. Fill them in on your plans and make them transparent.
The TFI tells us your school’s annual evaluation is an essential data-level element of your PBIS implementation. Look back on the work you’ve accomplished this year and pull out the highlights. Then, instead of emailing a few graphs and calling it a day, take the opportunity to tell a data story. Set the scene by sharing the overall view of the year. Point out the patterns and outliers that called your team’s attention and tell your audience why those data made you curious. Bring the audience along in the story by sharing the ways they were part of the solution and then show them what you all achieved together. Remind them the work is never finished by filling them in on the plans you have for building momentum in the coming school year.