


I’m a runner. Specifically, I’m an early morning runner. It works best for my schedule and if I wait to do it later, I always have an excuse for why it’s now too late to go for a run. The thing about being an early morning runner is, in the winter, the mornings are so cold and so dark. I have winter running clothes and winter running routes. This morning, I noticed something else about my winter runs. I make a specific decision on these dark mornings that I don’t make in the lighter ones: When to run on the sidewalk vs the bike lane. Here it is:
If there is a tall laurel hedge lining the sidewalk, I slide over and run in the bike lane.
That laurel hedge is always there. Whether it’s light outside or dark, that hedge is always there. Literally nothing bad has ever happened to me or anyone I know next to a laurel hedge, and still, when it’s dark outside, I won’t run next to it without a sidewalk buffer. That’s because I’m afraid of what could be living in that hedge (a squirrel, specifically) and the way it will use the cover of night as it’s opportunity to jump out just as I run by.
I know. It’s not logical, but I don’t have the time to negotiate with that illogical part of my brain on my run. The most efficient thing for me to do in that moment is veer into that bike lane for two seconds and avoid accidentally confirming my irrational fear altogether.
We all have moments in our day where we make decisions based on context instead of logic and deliberation. A dark morning run involving a hedge is one of those moments for me. These situations have a name. They’re called vulnerable decision points (VDP). We’ve written about them before, but here’s a quick synopsis.
What’s a Vulnerable Decision Point?
Research defines a VDP as a “contextual event or element of the immediate situation that increases the likelihood of bias affecting discipline decision making.”1 Basically, VDPs are the times when our decisions are more likely influenced by our unconscious bias. The moments look different for everyone, but in general, VDPs happen when a decision is ambiguous or uncertain, or when we’re not at our best, like when we’re hungry, tired, or afraid of squirrels. [Yes, I know the fear is irrational. No, it doesn't change how I feel.]
I bet if you thought about it for a second, you could name your most vulnerable point during the school day. I even wonder how many of you would describe the same VDP. Dr. Sean Austin wondered the same thing.
Lucky for us, he wrote his entire dissertation about it.2
In his review of SWIS referral data entered during the 2018-19 school year, he looked for the most common VDPs and whether specific elements contributed more in those contexts than others. He found:
- The most common VDPs happen in the classroom.
- Subjective behaviors were among the top behaviors contributing to school wide disparities.
- The top three contexts were defiance in the classroom in the afternoon, morning, and midday. You know, just all the time.
When you define your problem with precision, the decision you make fits the exact problem you're trying to solve.
Dr. Austin found a lot of interesting things in that dataset, but there’s one more I want to talk about here. Before I do, we need to define one more term: precise problem statement (PPS).
What’s a Precise Problem Statement?
A PPS is a way to describe the specific situation generating the most referrals in your building. If you know the hallway seems real rowdy lately, you can drill down into your referral data to find out precisely what’s happening in the hallways to make them feel that way. When you define your problem with precision, the decisions you make fit the exact problem you’re trying to solve. In order for a statement to be precise, it must answer the following questions:
- What is the behavior?
- Where is it most likely to occur?
- When is it most likely to happen?
- Who is most likely to contribute to it?
- Why are they most likely to do it?
For example: As they walk through the hall on their way to lunch, 8th graders talk loudly with their friends (likely for peer attention) and disrupt the nearby classrooms. The sentence has all the elements present and accounted for:
- What: Disruption
- Where: Hallway
- When: Around lunchtime
- Who: 8th graders
- Why: Peer attention
With a sentence like this, we aren’t trying to solve hallway noise in general; we’re designing solutions to help 8th graders get to lunch quietly.
So, what does a precise problem statement have to do with finding your school’s most vulnerable decision point? I’m glad you asked.
Remember that dissertation?
Dr. Austin found in 63% of schools included in the dataset, their PPS and their strongest VDP were exactly the same thing.
This means, when you use the Drill Down Tool in SWIS to create your PPS, it might also be your strongest VDP. And even if it’s not the strongest VDP, viewing your PPS through an equity lens adds information to consider as you come up with potential solutions. Are you ready to learn how to use your SWIS referral data to find your school’s VDPs? Buckle up. Here’s oneway to do it. [If you want to follow along, all of these graphs come from the SWIS Demo account. Log in and generate these graphs with me!]
Step 1: Check the Big Picture
In SWIS, there are a few places to get a quick school wide picture of the behaviors happening in your building. One is on the SWIS dashboard.Take a peek at those seven graphs. What do you notice? Are there any spikes that catch your attention and make you want to know more? For example, on my dashboard these two graphs caught my eye.


I notice most of our referrals come from classrooms and we refer a lot of students for defiance and inappropriate language. I wonder whether these two graphs overlap. How many of the referrals for defiance and inappropriate language happen in the classroom. It’s starting to sound like the beginning of a precise problem statement, don’t you think?
Another big picture place to check is your school’s Equity Report. When you generate this report, check the numbers for each of the student groups. In my school, I notice 51% of our Black students have received at least one referral (the risk index) and all Black students are at more than twice the risk of receiving a referral than any other students in our building (the risk ratio).


Now, I’m starting to put my two big pictures together and it makes me wonder how many Black students were referred for defiance and inappropriate language compared to other students in our school. It’s time to start getting precise.
Step 2: Drill Down to Get Precise
You know when the moment arrives for you and your talents to really shine? This is that moment for the Drill Down Tool. All you have to do now is put it to work. Take those spikes that caught your eye and start adding them to the filters to include. I added Classroom first and generated the report. I checked the behaviors happening most frequently in our classrooms and confirmed they are still defiance and inappropriate language. So, I added those as filters to include, too. For our statement to be precise, I still need three more components: Who, When, and Why. Keep going, adding filters to the list until you know the most common context for behaviors in your school. We even have a worksheet to help you do this part. Because I know you’re on the edge of your seat about it, I’ll tell you what my PPS turned out to be:
At the beginning of the day, 6th, 7th, and 8th graders receive referrals in their classroom for defiance and inappropriate behavior most often to avoid a task.
As a team, we could stop here and start talking about what’s happening in the mornings and how we might be able to solve this problem. Or, we could add one more layer and see how this PPS looks from an equity standpoint.
Step 3: View Your PPS Through an Equity Lens
With all your PPS drill down filters in place, change the graph type to Equity: Risk Ratio. What you’re looking at here is how likely are you to refer a specific group at least once in this specific context. A Risk Ratio of 1.0 says there is an equal risk, anything over 1.0 is a higher risk, and anything under 1.0 is a lower risk. When I generate the Risk Ratio for my PPS, here is what I see.
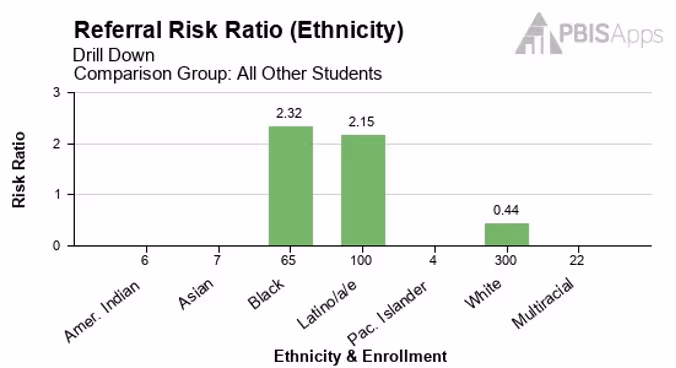
Black students and Hispanic/Latino/a/e students are at more than twice the risk of being referred for defiance and inappropriate language in their classrooms at the beginning of the day than other students. Their White peers are at a much lower risk. Then, when I think back to our Equity Report, the Risk Ratio for Black students overall is similar to the Risk Ratio we see for our PPS. The more surprising thing I notice is, the Risk Ratio for Hispanic/Latino/a/e students on the Equity Report was less than 1.0; their Risk Ratio in our PPS is 2.15. The PPS for this school would appear to be a strong VDP.
By layering on this equity lens, how did it change the problem? What new questions do you have? What new solutions are you thinking about?
At this point, you know which context contributes to the most referrals. You also know how referral patterns within that context look when you break apart the data by race and ethnicity. That’s a lot of information to start discussing possible solutions. If you want to take it one step further, you can check adult responses in this context next.
Step 4: Review the Actions Taken
Because our PPS appears to also be a VDP for our school, I am curious to see if the adult responses in this context are different for our Black and Hispanic/Latino/a/e students compared with our responses to other students in our building.
I checked each demographic one at a time. First, I left the filters for our PPS, added in Black students as a filter, and generated the Action Taken graph type. Then I removed that student group, added Hispanic/Latino/a/e students, and regenerated the Action Taken graph. Finally, I did the same for White students. Here are the graphs I saw. What do you notice?
Actions Taken for Black Students in the PPS

Actions Taken for Latino/a/e Students in the PPS

Actions Taken for White Students in the PPS

In these graphs, I notice the ways we respond differently to the same behaviors. I see several things our team might want to discuss, but in particular, I see Hispanic/Latino/a/e students are more likely to receive detention and lose privileges while their White peers get a conference or a phone call home. As a team, we need to explore why that is.
Let’s pause here.
We’ve covered a lot of ground. The process can be overwhelming, and yet…
Did you notice the way your brain started coming up with solutions based on the data you saw? Did you see how those solutions changed as you filtered data through an equity lens? And did you see how quickly you could shift your attention based on that new perspective? I mean, check this out! We started by saying defiance in classrooms was a problem to look at more closely. By the time we finished drilling down, we ended in a place where we wanted to focus our attention on middle schoolers as well as talk more about what’s happening in the mornings that makes this specific context such a vulnerable decision point in our school. When a problem seems large and insurmountable, data are an effective way to identify the details we need to make our most effective decisions.
Take this all in. Practice with your school’s data. Then come back next month when we’ll share more about what you can do once you’ve identified a VDP for your building.
1. McIntosh, K., Girvan, E., Horner, R., & Smolkowski, K. (2014). Education notIncarceration: A Conceptual Model for Reducing Racial and Ethnic Disproportionality in School Discipline. Journal of Applied Research On Children:Informing Policy for Children at Risk, 5(2).
2. Austin,S. C. (2022). National Patterns of Vulnerable Decision Points in School Discipline (Doctoral dissertation, University of Oregon).