


Do you watch Abbott Elementary? I cannot get enough of this show. Abbott Elementary is a TV show shot in a mockumentary-style similar to The Office. It’s about a group of teachers at a public elementary school called Abbott Elementary and how they overcome the same problems facing educators today. In this week’s episode, Janine, a second grade teacher at Abbott played by the incomparable Quinta Brunson, meets with a student’s parent to discuss how the student’s small disruptions have escalated throughout the year and how she could use some help figuring out how to make the rest of the year a little better. The meeting doesn’t go as planned and instead of identifying solutions, the meeting ends when the student’s mother calls her a bad teacher and leaves. The moment leaves Janine shaken and questioning her capability as a teacher.
The thing about sitcoms is they tend to present and solve a problem in the span of 30 minutes. Real life doesn’t quite work that way. However, the problem Janine faced in this episode and the emotions it elicited sure do reflect current realities in classrooms across the country.
Recently, the Institute of Education Science (IES) released a new set of data from its School Pulse Panel, "a study collecting information on the impact of the COVID-19 pandemic from a national sample of elementary, middle, high, and combined-grade public schools." Of the 846 schools responding to the most recent survey, 84% agreed or strongly agreed that student’s behavioral development was negatively impacted by the pandemic. Respondents said incidents of classroom disruptions, disrespect, and technology violations are all up since the beginning of the pandemic.1
Teachers are telling us they are overwhelmed by behavior. It’s time for us to help them address it.
Well, we talk about behavior support all the time over here. We also happen to have large datasets that help us make sense of what’s going on. Every year, we release a summary of the previous year’s discipline data trends.
I wondered what last year’s data could tell us about where to focus our solutions.
What’s Happening Nationally?
Nationally, the trends in overall discipline data continue to stay relatively stable.2
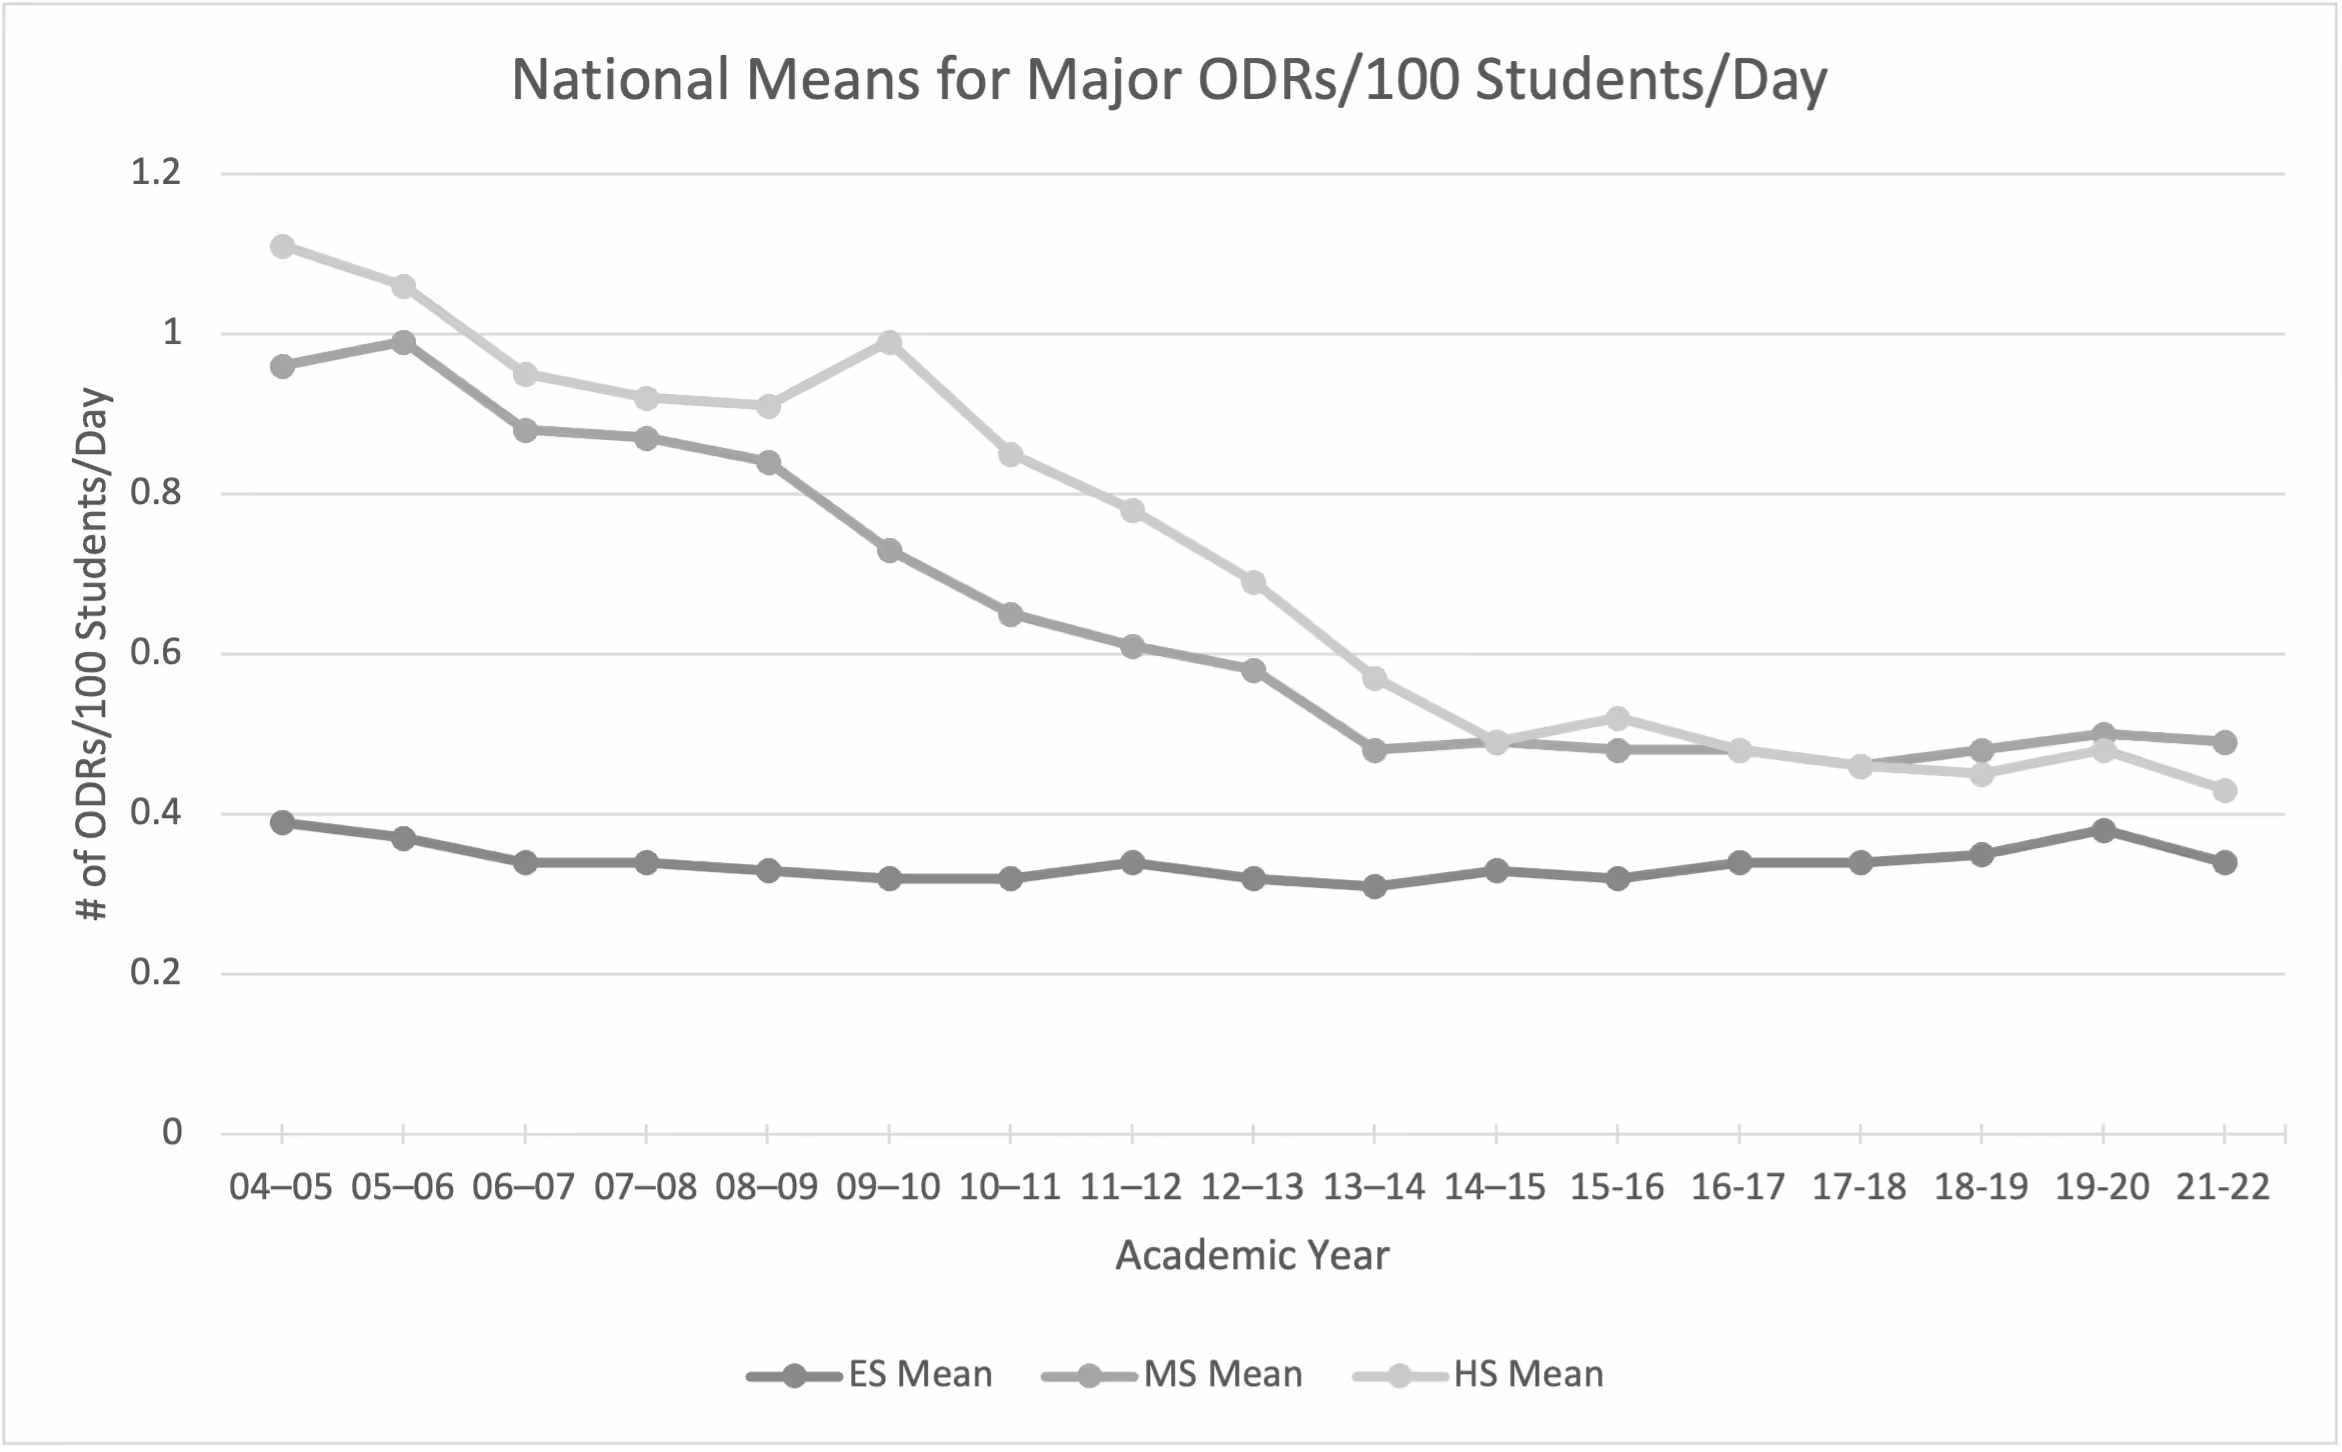
Reader, I know you see that 2019-20 school year and the way it spikes up. I see it, too. The 2019-20 school year was a partial year; school happened like usual until March 2020 and then data collection stopped. So, while we include it in the graph because there are enough data to put it there, it is also unlike the other years in the report. Moving on.
The picture didn’t quite line up for me with the experiences from teachers across the country. I expected to see a big increase this year. While I see the slightest trend up, these data are mostly stable since 2016-17. So, what’s going on? If there’s one thing we know about data, it’s that one picture can’t tell us everything.
Let’s talk about what isn’t included in this graph. First, these are trends for “major” referrals only — referrals for behaviors handled by an administrator, outside the classroom. What about the behaviors teachers handle in their classrooms without sending students to the office? The survey data from NCES told us it’s those classroom-managed behaviors that have increased over time and those behaviors aren’t included in this picture.
Second, this is a national dataset. We’re looking at averages based on thousands of schools. Those averages give us a good idea of what’s happening overall, but they don’t tell us what’s happening exactly where you are. The good news is you have access to your own referral data to tell you more about what’s happening in your building.
What Do Your Data Tell You?
Open SWIS and check out your Year-end Report. There you’ll find a year-by-year comparison of the number of referrals per 100 students, for administrator-managed behaviors as well as classroom-managed behaviors, and all referrals combined! As you look at the trends:
- Do the averages trend up? Down? Remain relatively stable?
- What do you notice?
- Do your data confirm the overall feeling you have in your school?
- What surprises you?
In that same report, you’ll find graphs showing what percentage of your total referrals were written for each behavior. Write down the top five behaviors from the report. For example, in 2021-22, the top 5 behaviors were:
- Inappropriate Language (24% of the total referrals)
- Defiance (22%)
- Physical Aggression (12%)
- Harassment (12%)
- Tardy (8%)

Head back to the top of the page and select the 2018-19 school year (or other full year of data) from the School Year drop down menu. Checkout that same behavior report and list out the top five again.
- Do the same behaviors take up the same percentage of your referrals?
- Which behaviors are happening more frequently now? Less?
- How does the difference you notice match up with the way your school feels now compared to then?
We know data help us identify precisely what’s happening. We also know data fall flat until we can give them life through our lived experiences. The stories from your classrooms frame the context where these behaviors happen, so keep telling them. Eventually, conversations will turn to, "Now what are we going to do about it?”
Before you start immediately dosing up the behavior support you provide, you need to confirm you have the basic foundation nailed. Here are six questions to help you verify the core components of schoolwide support are in place.
Who’s on Our Leadership Team?
So much about how your school supports student behavior depends on the people leading the effort, specifically your schoolwide leadership team. This is the team of people from your school who work together and commit to:
- Creating a positive school climate
- Using data to drive decisions, evaluate implementation, and share out how everything is going
- Establishing how to select, train, and coach new staff on how you support behavior in your school
For your leadership team to be in place, it needs to have a coordinator, an administrator, a family member, and staff representation across grade levels. At the high school level, maybe you include a student on your team, too. Double-check you have all members present on the team and everyone has the time available to attend most meetings.
Did We Teach Expectations?
You probably have a set of schoolwide expectations—the social, emotional, and behavioral skills you hope to see from everyone. Maybe they even spell out an easy-to-remember acronym like SOAR or PRIDE. Perfect! Did you teach students what those expectations mean and when was the last time you reminded them? Sometimes it seems obvious what Be Safe means on the playground, but until you explicitly teach students what it means and what it looks like, it’s open to their interpretation. Let them know what you’re looking for and how specific behaviors will make the space feel more welcoming. Ask students to join in the conversation by sharing about the expectations they experience outside of school, at home, or in their community.
Teaching expectations isn’t a one-and-done practice. It’s something you need to do throughout the year. Reminders about what each expectation means and what it looks like when students are with you makes it more likely they’ll know exactly what to say when someone asks them, “What does PRIDE mean here in our school?”
Do All Staff Know How to Respond to Behavior?
When student behavior aligns with your schoolwide and classroom expectations, it’s important to let them know. The continuum of strategies you use for acknowledging those moments should be accessible and to all staff. Acknowledgements can be tokens or even simple statements like, “Hey, I see you looking up with your pencil in hand. Thanks for paying such close attention.”
Along with a continuum of strategies to acknowledge student behavior, you have a continuum of consequences for when behaviors don’t align with expectations. That continuum includes your school’s referral process. Make sure everyone in your building knows when to manage behaviors in class and when to send students out of class for more support.
Do Students Know Our School and Classroom Routines?
Every school a set of procedures, schedules, and routines that create consistency and make the day-to-day functions more predictable for everyone. Within those practices are the procedures, schedules, and routines happening in every classroom in your school. The more predictable you can make your routines, the more likely it is for behaviors to align with expectations. How closely do your classroom routines and expectations match up with your schoolwide systems and practices? Make sure all students know how to turn in assignments, how those assignments can be made up, what happens when they walk in at the beginning of class, what needs to happen at the end of class, and every procedure in between.
Do Our Students and Their Families Have a Say?
Numerous studies confirm that actively engaged families play a major role in improving academic and behavior outcomes for their students.2 When students are engaged in their education, they are more hopeful about their future, more empowered, more connected to their school, and they begin to think more critically about the systems around them.4 Including student and family perspectives in the support you provide is essential to your PBIS implementation. There are lots of ways to leverage your existing practices to get these perspectives shared and included in your conversations.
Are We Using Data?
We started this article by sharing data, so it only seems right to end it by asking you how you use data in your school. If behavior is a concern in your building, track it. Make sure all staff know how they can use referral data as a way to communicate the daily experiences they have in their classrooms. If you aren’t tracking classroom-managed behaviors, why not start now?
Speaking of starting…
We get it. The last three years disrupted so many of our regular routines, including assessing implementation fidelity. If it’s been awhile since you took the Tiered Fidelity Inventory (TFI) or the School Climate Survey (SCS), get them back on your calendar. These assessments coupled with referral data give your team the information it needs to address the problems you face more precisely.
These six questions help you answer the larger questions we ask all the time in PBIS implementation: Are we doing what we said we would do? And whenever we ask that question, the odds are high there is a fidelity assessment you can take to help you answer it. Guess what? In this case, the TFI is exactly the assessment you need. The first 15 questions on the survey assess how many of the core features of schoolwide support you have in place at your school: leadership teams, expectations, acknowledgements, consequences, routines, family partnerships, and of course, data-driven decisions. The TFI will help you find out which ones are solid and which ones need some attention. When you’ve firmed up your schoolwide foundation, you’re ready to start layering on additional support.
A cliff hanger? Yes, but part two is coming next week. In our April podcast episode learn how to dose up the support you provide to all students by taking advantage of some specific high-leverage practices.