


Does your state or district have a PBIS recognition system? I see hands going up. These systems offer a way to acknowledge the PBIS implementation happening in schools throughout the area. To be recognized, typically schools submit their fidelity data — most likely from the Tiered Fidelity Inventory (TFI) — along with data related to other outcomes, like referral counts, or trainings teams have attended. It’s one way states and districts can get a sense of overall implementation efforts and a nice way for schools to get some kudos for the work they’ve done during the year.
You could insert some graphs into a word document, bullet point your successes and challenges, and summarize your action plan for next year. That’s something you could do. What if you took this opportunity to tell a data story instead?
Recently, the Center on PBIS released an evaluation brief exploring whether these recognition systems encourage schools to sustain their implementation over the long haul.1 In short, the answer is: yes, they do!

The brief zoomed in on five specific states and the percentage of schools in each state implementing PBIS at fidelity over seven years. States 1, 3, 4, and 5 had recognition systems in place; State 2 did not. They found the percent of schools implementing PBIS with fidelity increased over time in states using recognition systems.
At this point, I know what you’re thinking. “Megan, there is one state on this graph with more schools implementing at fidelity than the others. What’s happening on there?”
Thank you so much for asking. I’d love to tell you.
There was one aspect of State 3’s recognition system that was different from the others. To be considered for recognition in State 3, schools had to submit their fidelity data, but there was no requirement they had to meet fidelity criteria. Removing a minimum score from the list of recognition requirements frees schools up to assess their implementation more accurately. When fidelity assessments demonstrate a school's actual implementation level, states and districts can direct additional resources, professional development, and coaching toward the appropriate PBIS essential elements. It would seem, when educators have what they need to improve their work, schools are more likely to sustain their implementation for years.
Whether you share your data with state-level evaluators or with your schoolwide community, evaluating your PBIS implementation is an essential data element at every tier.
What’s an Evaluation Plan?
As with all elements of PBIS, we turn again to the TFI to find out exactly what is an evaluation plan. According to the TFI, every team should create a plan to document “the fidelity and effectiveness of equitable practices at least annually.” The plan should:
- Be written down
- Include multiple data sources (fidelity data and outcome data)
- Be shared with the people who care about your implementation the most
In short, your evaluation plan is your opportunity to share with your larger community the work you’ve accomplished, and to highlight how you achieved those outcomes together.
You could insert some graphs into a word document, bullet point your successes and challenges, and summarize your action plan for next year. That’s something you could do. What if you took this opportunity to tell a data story instead?
What’s a Data Story?
According to Harvard Business School, data storytelling is “the ability to effectively communicate insights from a dataset using narratives and visualizations. The story puts your insights into context and inspires action from your audience.”2 To tell a good data story, it needs to include:
- Data: The foundation upon which you build your story.
- Visuals: A graphic representation of the data.
- Narrative: The insights, context, and actions you get from analyzing the data.
Whether you realized it or not, your team has been telling data stories all year long. You’ve uncovered important insights and acted on them. Now is the perfect time to share the stories from that work with the people who care about it the most. Here are five steps you can follow to transform your annual evaluation into a data story worth telling.
1. Start at the Beginning
While some stories start in the middle, this is a time where your story works best from the beginning. A good data story sets the stage with an overall view of how things are going. This is a good place to share graphs like:
- Average Referrals per Day per Month from SWIS
- TFI Total Score and Scale Reports from PBIS Assessment
- Triangle Data Report from the SWIS Year-end Report
This is also a good place to add supplemental data to highlight what you want folks to understand. What story would you tell if you shared a multi-year version of the Average Referrals per Day per Month graph? How would that story change if you compared your current year's averages with the national averages for schools of similar size. How do your behavior trends match your TFI scores? Think about the overall story you want to tell your schoolwide community, then use your data and visuals to support it.
2. Share What Made You Curious
At some point this year, something in your data caught your attention and made you curious to know more. In a traditional story arc, we’d call this moment the “inciting incident” — the moment near the beginning of a story that sets things moving in a specific direction.
Think about what that moment was for your team — a time when you noticed a pattern or an outlier and decided to focus on solving it. Tell your audience why the data piqued your curiosity. Bring them along in your process. For example, let’s say this was our school’s Referrals by Behavior graph.
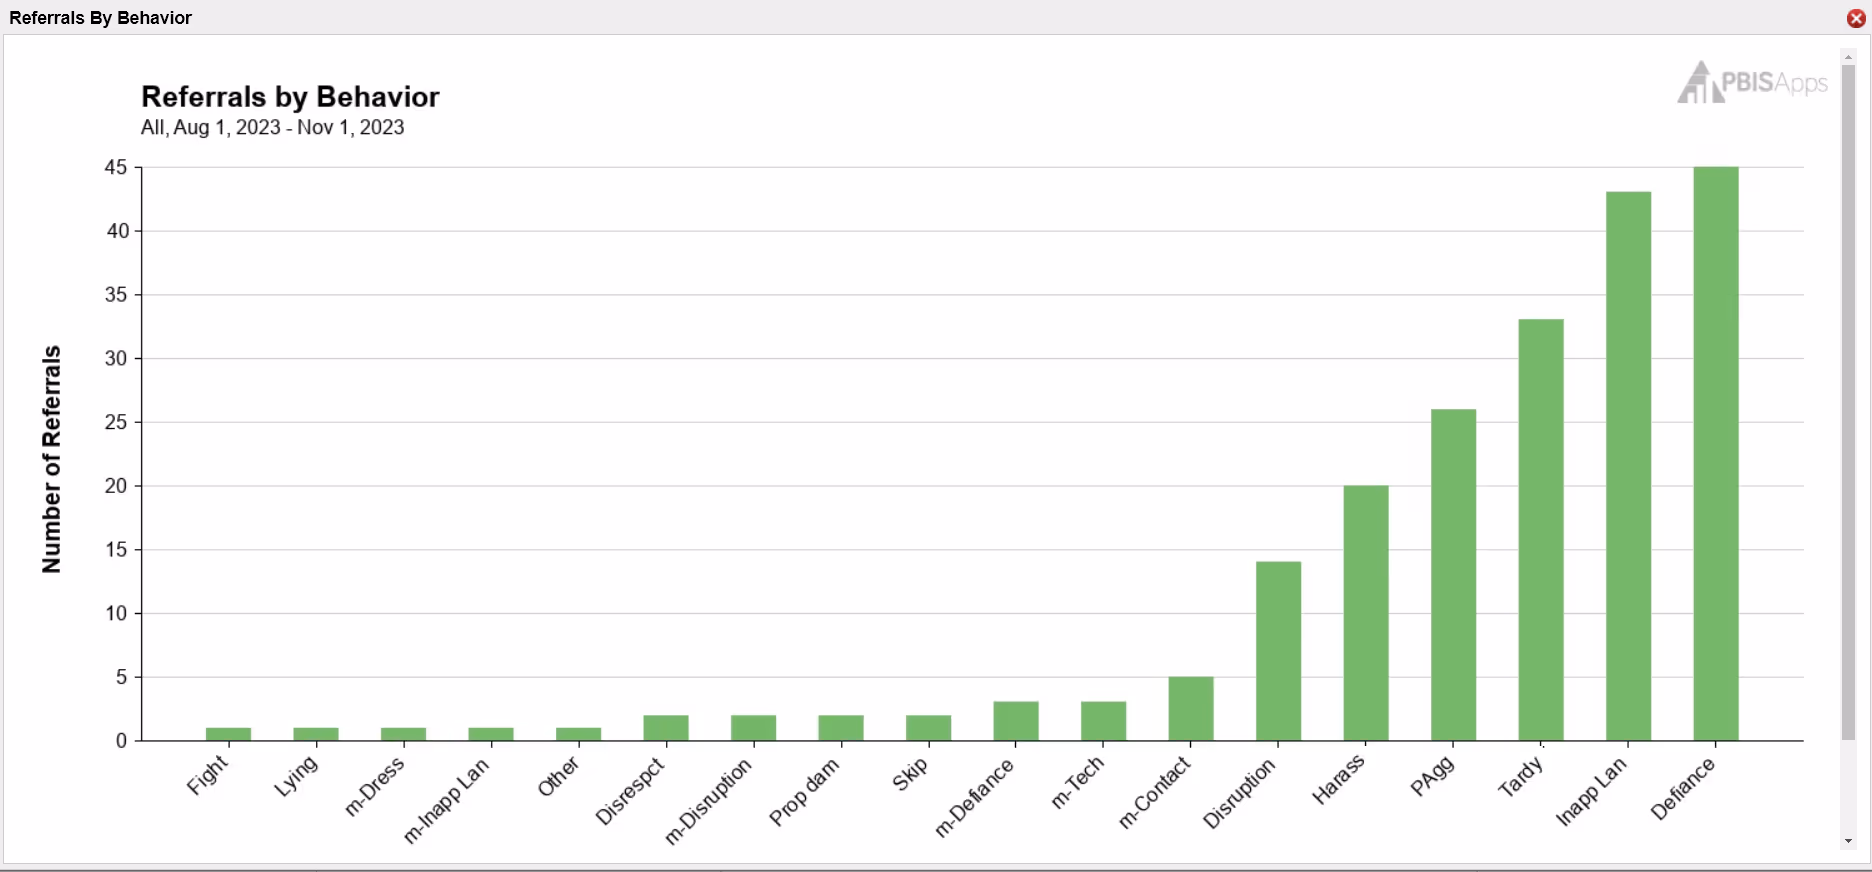
The inclination might have been to focus on Defiance and Inappropriate Language. This team focused on Tardy because of what they knew about their school. They knew staff were talking about students coming late to class and their data backed up those experiences. In this section of the annual evaluation, sharing this story would let everyone know how the team used what they know about their school to prioritize their data-driven decisions.
3. Add Your Audience to the Story
There’s been a lot of data so far. It’s time to add your reader as a character in the story. Share the practices you implemented and the systems you modified solve the problem. It’s the perfect time to highlight the ways your schoolwide community participated. PBIS implementation is a team effort. Even though they might not sit around that monthly table with you looking at data and making decisions, the improved outcomes you want are only possible when everyone works together. Remind them how students, staff, and families worked together this year.
4. Nail the Punchline
Now that you’ve successfully built the tension, it’s time to tell the reader what happened. Show those outcomes! All school year, your team used data to drive decisions. You also used data to monitor progress. We know what the data looked like before, so show them what everyone’s efforts achieved.
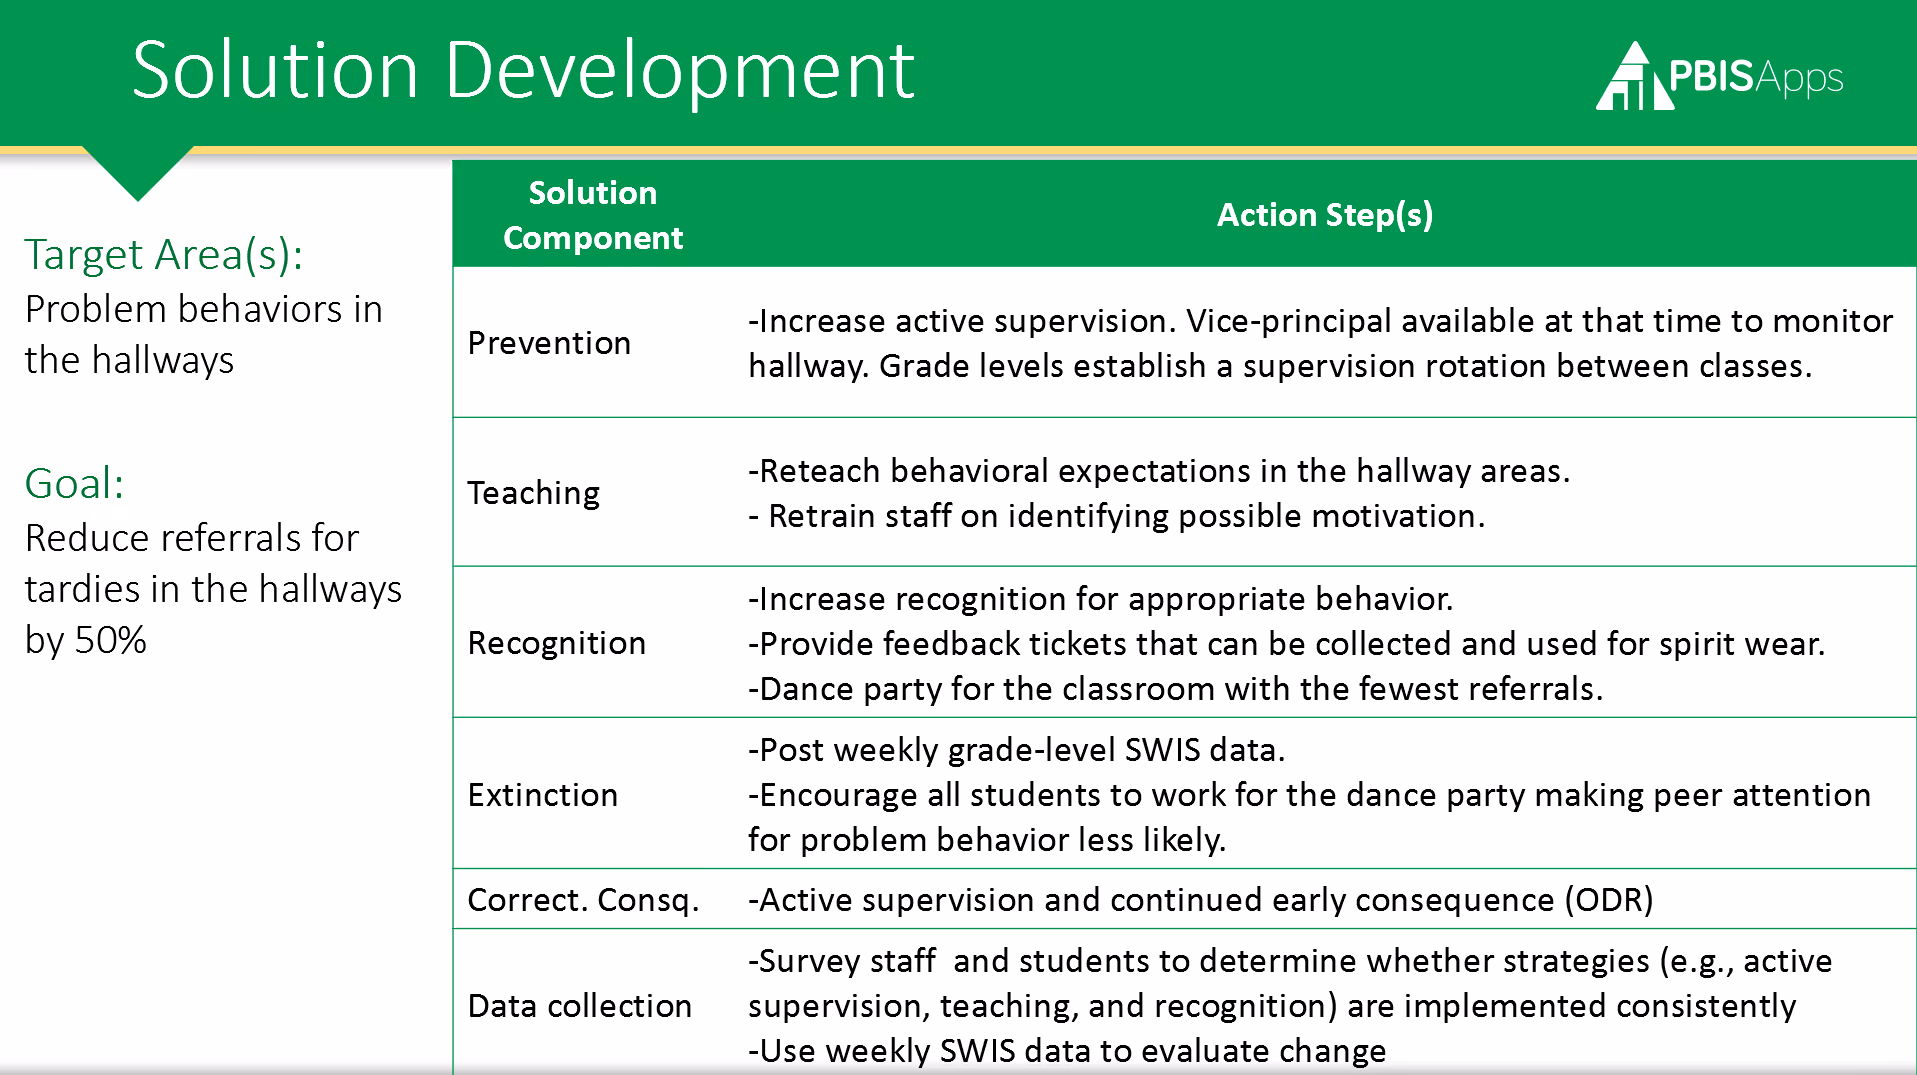
At this point in our example story, share how there were 30% fewer referrals for tardy in the second half of the year than during the first part of the year! Even though the school didn’t meet its goal of a 50% reduction, you can make a plan to build on the progress next year.
5. Tell Them What Comes Next
The good news about your data story is there will always be a sequel. Your work doesn’t end with the school year. You’ll pick things right up in August. Use the end of this data story to tell folks what comes next.
Make an action plan of what you want to do at the beginning of the year and share it with your audience [INSERT LINK TO MACGUYVER ARTICLE]. Will you have professional development opportunities? Will you continue with the practices you put in place at the end of the year? What should they expect from you at the beginning of the year?
Don’t leave your audience in suspense. Fill them in on your plans and make them transparent.
Your school’s annual evaluation plan should be more than just a reporting requirement. This is your opportunity to tell a story about how you used data to notice problems, make decisions, and improve outcomes. Help your schoolwide community see themselves in the improvements you achieved over the course of the school year. Build momentum for what comes next by making successes, challenges, and plans visible to everyone involved.