


I’m an accidental runner. It was never my intention to become a runner. One day it just happened. I’ve run four half marathons in my life — three of them were also an accident, but that’s a story for another day. My point is, I run regularly. Maybe you’re a runner, too. If you are, you know how important it is to keep running if you plan to run more in the future.
Reader, I stopped running this summer.
I didn’t run for five weeks. Then, last weekend, I laced up my shoes and hit the path near my house. It is no exaggeration when I say I was gasping for air after the first quarter mile. I disrupted my consistent practice and paid dearly in the outcome. It’s a lesson I learn...then forget...then learn again, often.
PBIS implementation operates similarly. You go through the work to get everything in place and then one day, you think maybe we don’t need to do this thing quite so much. You don’t notice the impact right away. Then, eventually, maybe five weeks later, you go to lace up your shoes and you realize just how important that thing was to the whole process.
In case you’re feeling a little rusty, let’s remind ourselves exactly which elements are essential to your PBIS implementation...and then we’ll focus on one element that often gets neglected.
Once you spin up those PBIS systems and practices, how do you know if they’re working? If you said “Data,” give yourself a star because, of course it’s data!
Essential Elements of PBIS
Most frameworks use a graphic to describe visually how the elements work together. PBIS has two — The Triangle representing the multi-tiered nature of the framework and The Circles representing the essential elements.
There are three essential elements of PBIS:
- Systems: The policies, procedures, processes, and priorities supporting the adults implementing the framework.
- Data: The information you use to guide your next steps, evaluate how things have been going, and sound the alarm when something needs to change.
- Practices: The things you DO WITH your students.
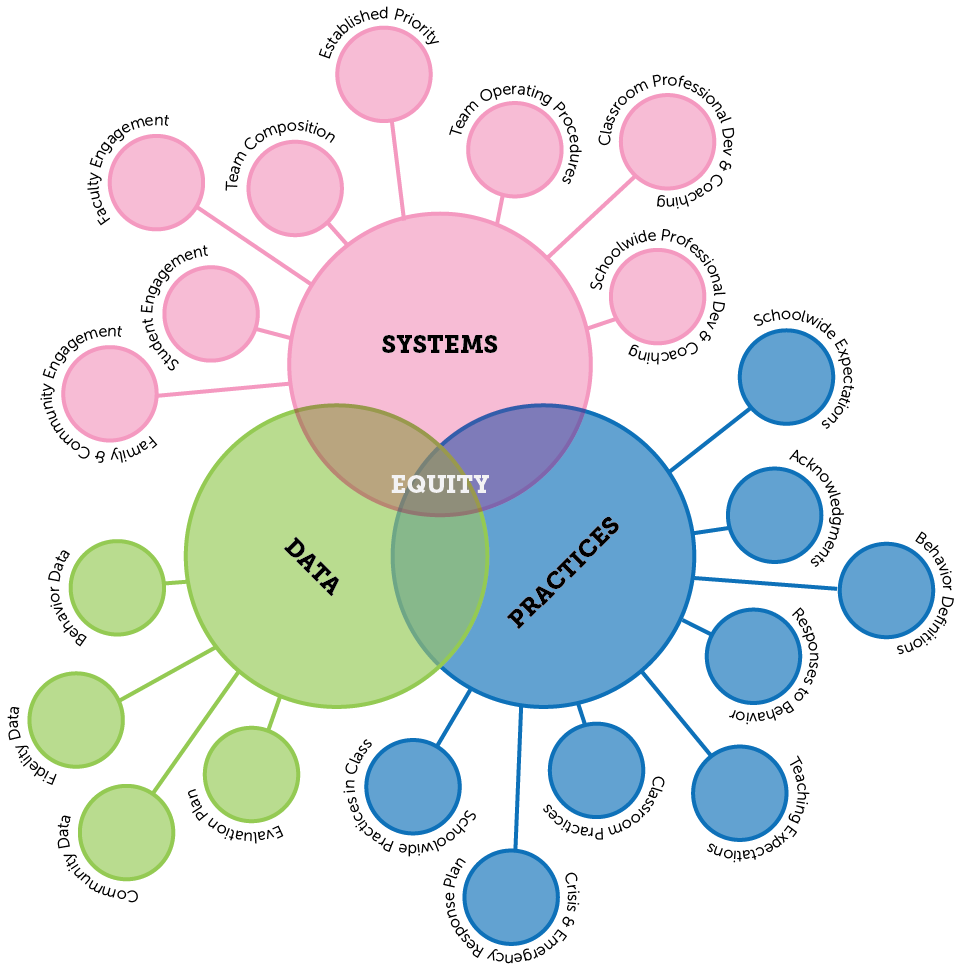
Note: This is an updated version of the expanded graphic we released in 2023. It now aligns with features described in the TFI 3.0 — an updated version of the TFI prioritizing mental health supports, equity, and classroom implementation.
It’s easy to focus more attention on PBIS systems and practices. Who doesn’t love talking about setting up school stores, teaching expectations, and engaging families from our schoolwide community?
I know! So do I!
Here’s the catch, though. Once you spin up those PBIS systems and practices, how do you know if they’re working? If you said “Data,” give yourself a star because, of course it’s data! While systems and practices make PBIS visible in your school, data help you sustain those efforts over the long haul.
Data in PBIS
Every tier in your PBIS implementation comes with a set of data you’ll use to answer the questions:
- Are we doing what we said we would do?
- Are we achieving the outcomes we hope to see?
At Tier 1, your fidelity, community, and behavior data offer insights to help your team answer those questions. While these data are foundational, it’s easy to see how they might be the first features we neglect when we get a little inconsistent in our implementation.
.png)
We don’t play favorites with data around here. However, behavior data have always played a central role in our work here at PBISApps — specifically, using referrals to drive decisions and continuously improve PBIS implementation. Every referral tells a small story about a student’s behavior and how someone reacted to it. It’s a piece of data and according to research, it’s a decent measure for predicting teacher perceptions, student perceptions, chronic behavior issues, and academic outcomes.1
The TFI tells us your team needs access to behavior data that includes:
- All information relevant for decision making
- Perceived function
- Reports by behavior, frequency, location, time, action taken, and individual student
Good news: If your school uses SWIS, you’re nailing this element already!
The TFI also tells us your team needs to regularly use those data to evaluate the outcomes you’re trying to achieve. To do that, you need meaningful data and for referral data to be meaningful, you need consistent systems and practices for collecting them. Here are a few of our favorite tips to ensure the systems surrounding your referral data generate the right information, in the right way, at the right time.
Define Observable, Measurable, Specific Behaviors
What happens when the best way to define a word is with a feeling? Subjective behaviors like “defiance,” “disrespect,” and “disruption” are like that. Unfortunately, when it comes to your school’s referral process, a feeling isn’t enough. Concrete behavior definitions help operationalize these squishy terms. One way to make sure your subjective behaviors operate more objectively is to define what’s observable, measurable, and specific about them.
- Observable: Define the behavior in terms you can see. What did someone do that made you think they were being defiant?
- Measurable: Place the behavior on an intensity scale. What would it look like as a small issue? How would it sound if it was a big deal?
- Specific: Define what the behavior is as well as what it isn’t. When does the behavior become actionable?
Clearly defined behaviors help reduce confusion and keep your data reliable.
Get Everyone to Ask “Why?”
Does your school’s referral form include a space to indicate a student’s motivation for their behavior? It should. If you want to create durable, effective solutions, it’s important to name your best guess for why someone did what they did as part of every referral you write.
If you aren’t confident in your function-based assessments (FBA)s, check out my favorite trick from the Basic FBA training modules: describe what happened in a mad lib style sentence:
During [insert routine], when [insert what happened just before the behavior], the student [insert the observable behavior] and as a result [insert the consequence].
Completed, the sentence might look like this:
- During math, when I assigned a multi-digit multiplication worksheet, Martin broke his pencil and put his head on his desk, and as a result, I walked over to his desk and helped him get started.
- During reading, when students complete independent work, Ella whispered something to two other students, and as a result, her friends laughed and kept talking to her.
When you read the sentences out loud, you can see how Martin might want to avoid that math worksheet and maybe Ella was looking for some peer attention during independent work time. Considering motivation takes practice. This little trick is one way to add this data component to your referral routines.