


I started watching General Hospital in 9th grade. I was home sick with strep throat when I turned it on for the first time. I recorded it on our VCR every day so I could check in on Luke, Laura, Sonny, Brenda, Robin, and Stone. If you’ve ever dedicated yourself to one soap opera, you know how important it is to watch every episode. One day, everything is fine in the fictional land of Port Charles, NY. The next day, you’re on a multi-week storyline about mob ties and paternity tests. You don’t have to watch every day, but when you do, there are some days when the story becomes just a little clearer.
We know the data you collect tell compelling stories about the social culture in your school. So, what happens when you reach the day when the plot becomes clear and it’s time to take action? Based on national data, it might be time to take your implementation to the next level.
Every year, PBISApps releases a summary of referral trends based on data entered into SWIS.1 We’ve got data reaching back almost 20 years at this point. Call me nerdy, but I look forward to these updates. I think they tell a story about what’s happening in schools across the country and the experiences we've heard you tell. I’ve been waiting (sometimes patiently) for this year’s data, in particular, because of the story we’ve seen emerge over the last five years. This is the year I hoped would clarify the plot.
Let me tell you the Soap Opera Digest version of the story I see.
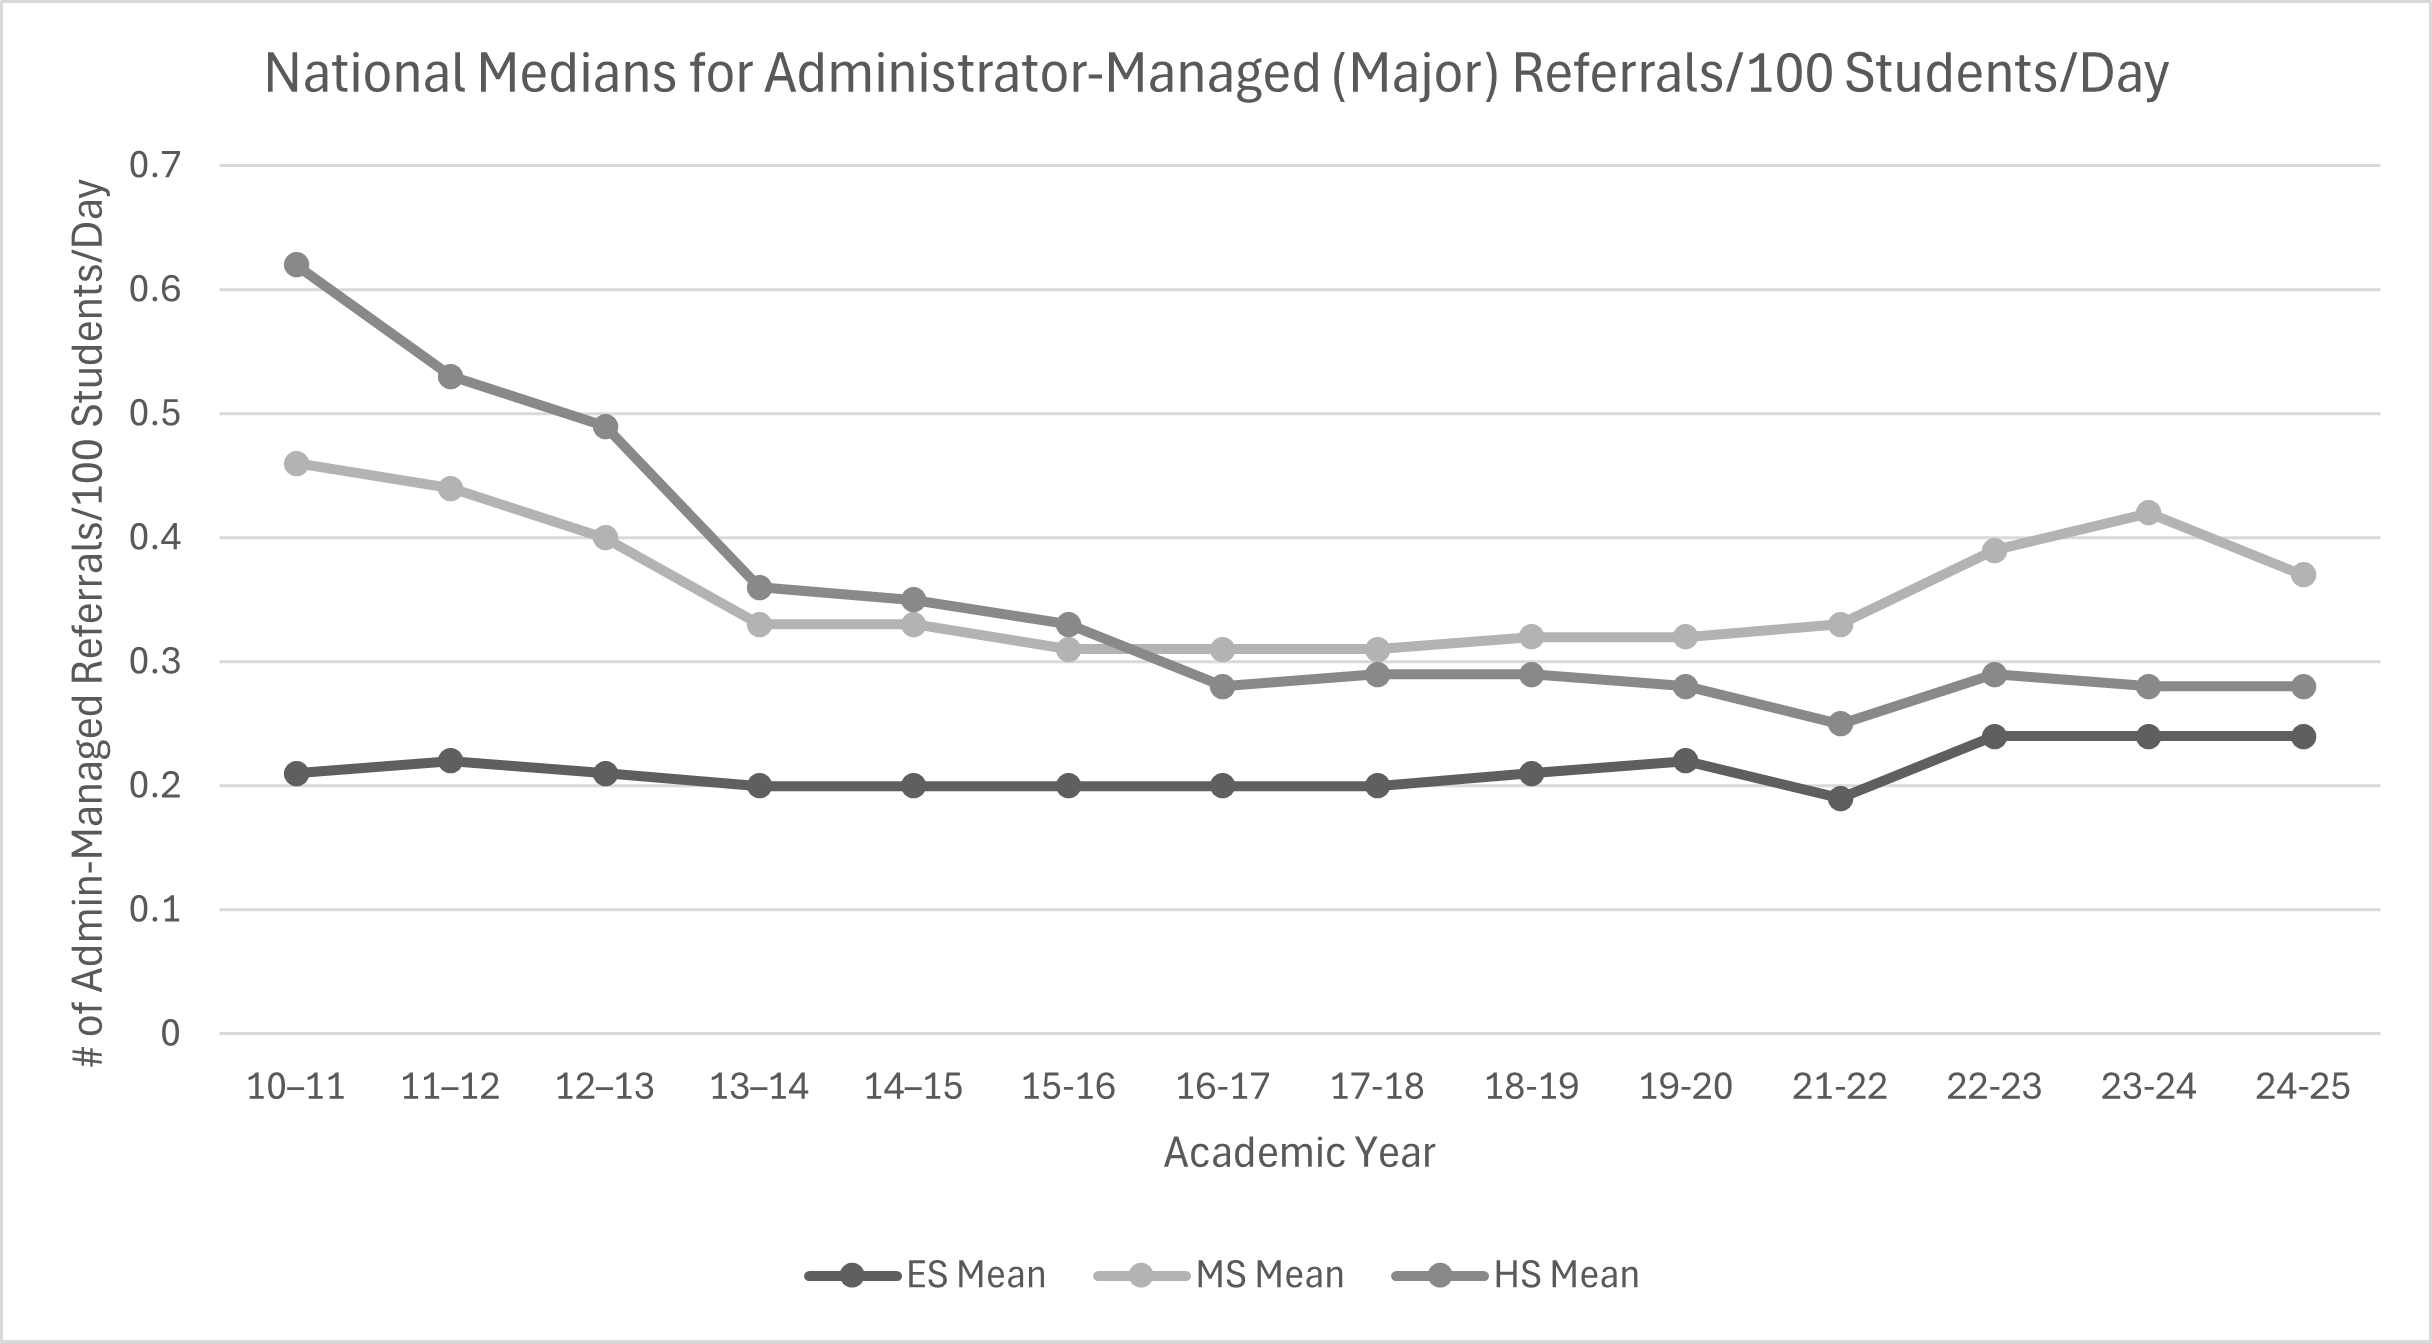
Nationally, referral patterns have been pretty consistent from 2010-11 to 2018-19. Then something happened.
- 2019-20 school year: Our first weird data related to the pandemic. Referral data entry stopped in March 2020, so we don’t get a great picture of what behavior patterns would have been under typical circumstances.
- 2020-21: Learning across the country took lots of forms. Some schools attended entirely online; some were in person; some were a combination of the two. Entering referrals into an online application took a low priority. We couldn’t calculate referral trends accurately, so they’re missing from the graph.
- 2021-22: Our first opportunity to see referral trends post-pandemic. The unexpected happened: rates went down. Maybe it makes sense, though. Restarting Tier 1 systems, practices, and data after two years of disruption from the pandemic meant data collection couldn’t happen like it used to. Teams spent more time focused on addressing academic gaps and supporting mental health needs than entering referral data.
- 2022-23: Data begin to reflect the stories and experiences we’ve heard for the last two years. Elementary, middle, and high schools all experienced an increase in the average number of referrals they wrote every day. Rates have stayed around this level ever since.
The graph tells a solid story. We also know it doesn’t tell us every detail. That graph represents the behaviors referred for an administrator to manage. What about the times a student never left class? What about the times teachers addressed a behavior in the moment and went right back to teaching? Those trends look like this:
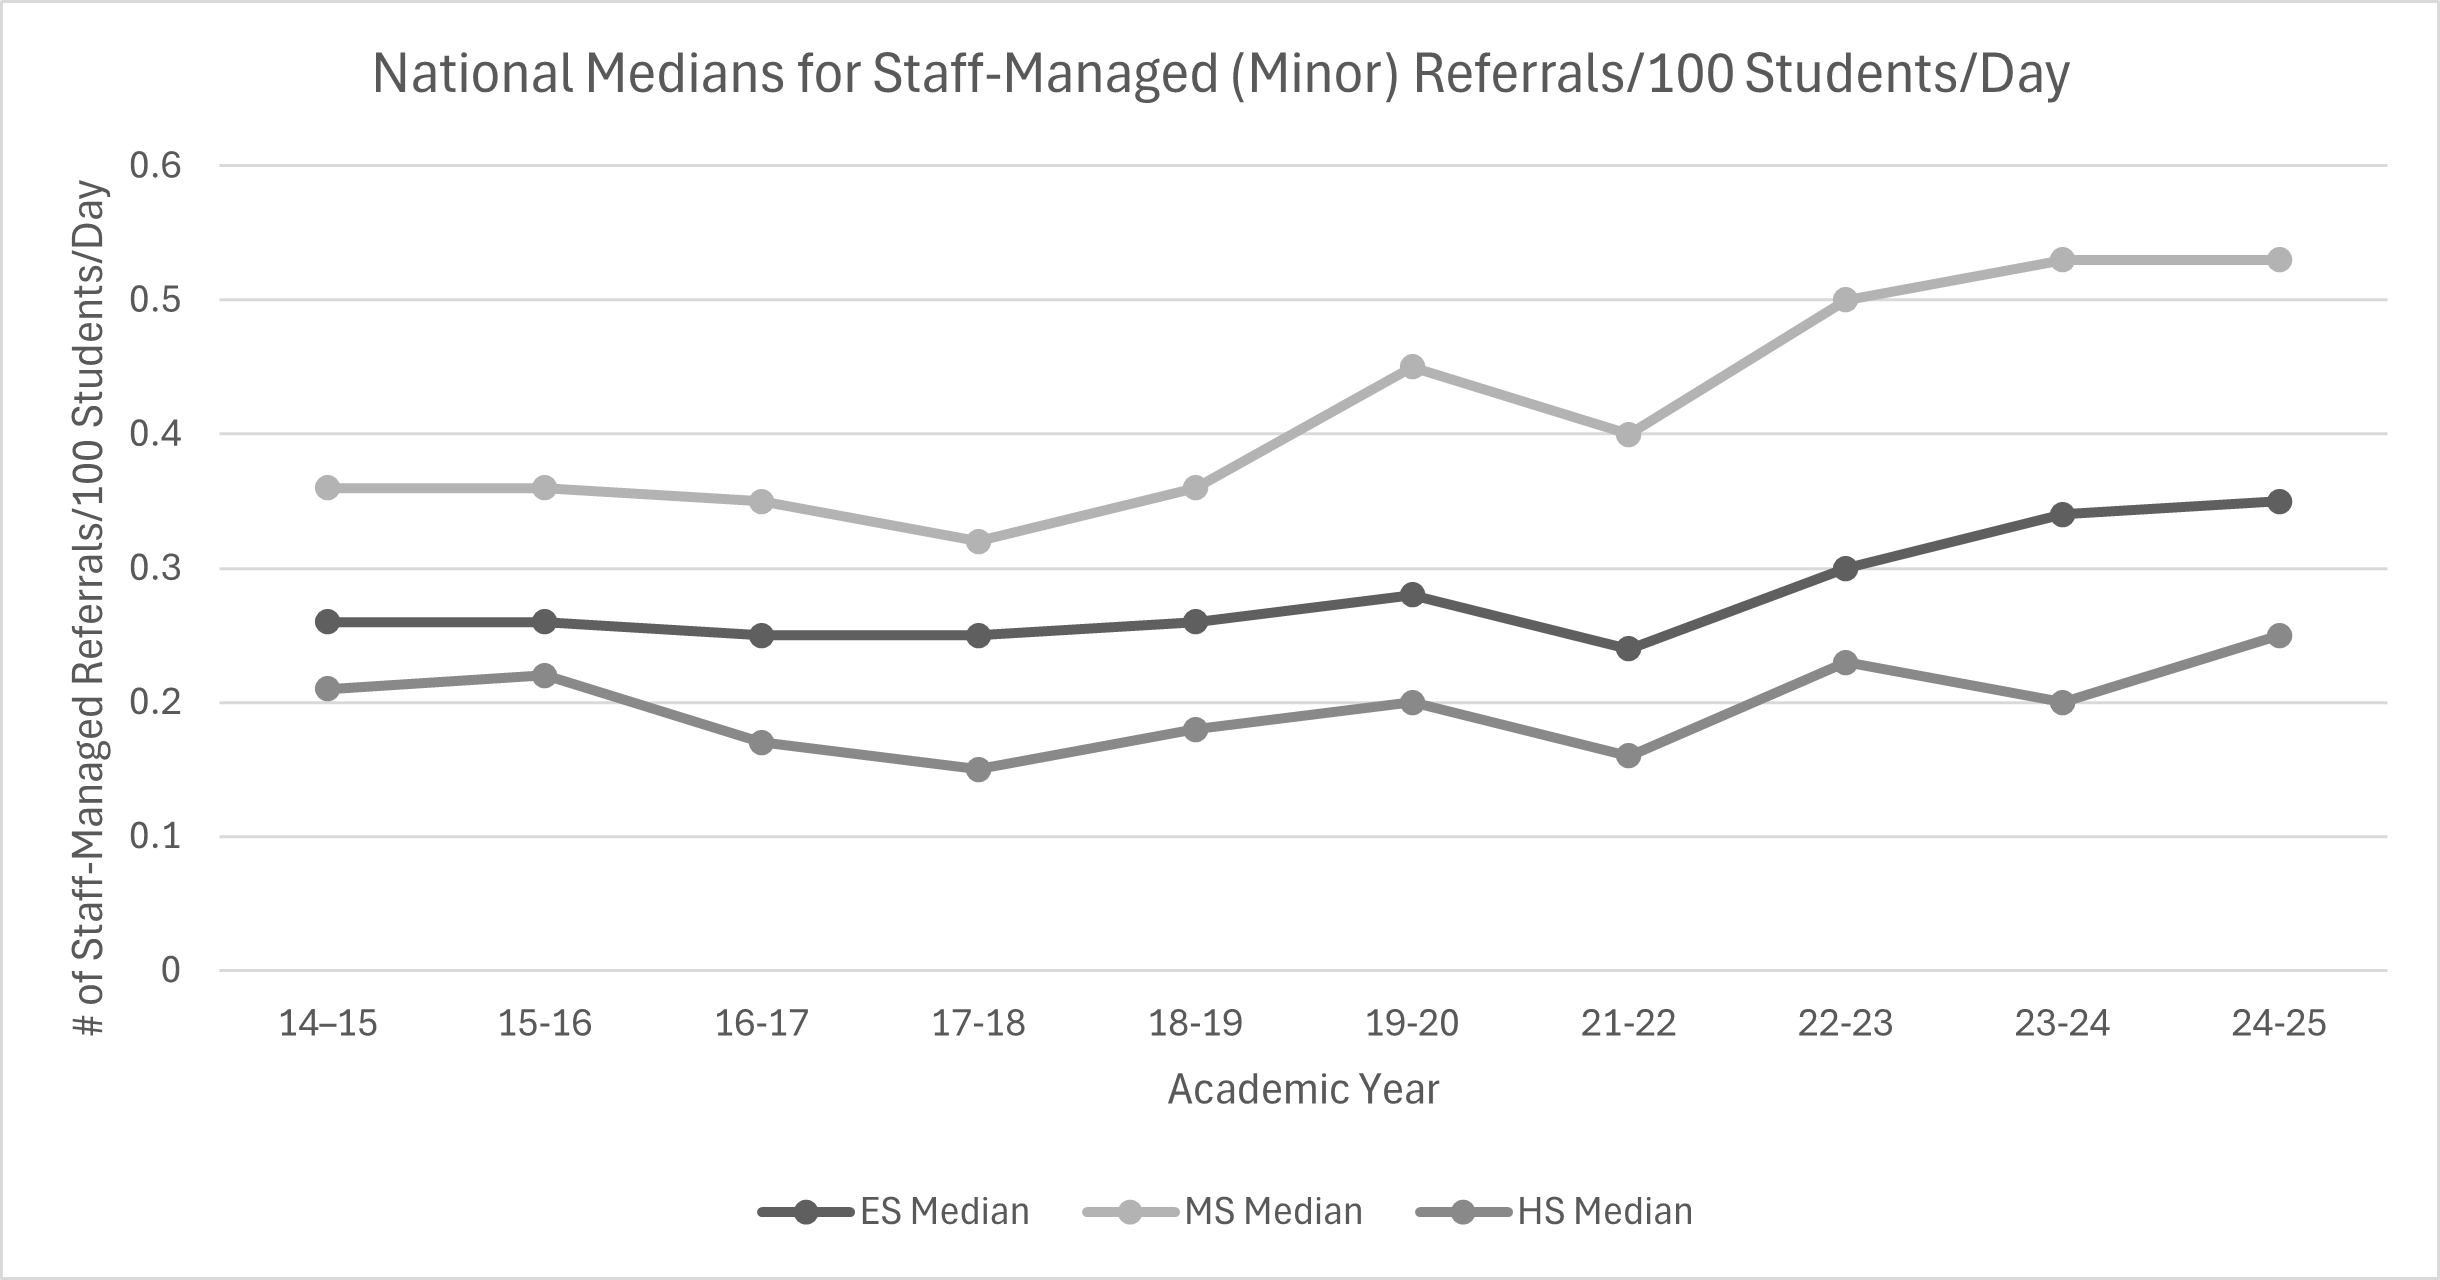
Just like administrator managed behaviors, staff-managed behaviors increased big time starting around the 2022-23 school year. In fact, I’d say their trends have an even more pronounced upward trajectory. The fact that schools are documenting staff-managed behaviors more frequently could mean they want to know more about the low-level behaviors happening before students end up in an administrator’s office. If that was the case, we’d also expect to see administrator-managed referral rates go down...and that just isn’t what we see. Trends are up across the board.
Which brings our story to its inevitable plot twist.
Research tells us schools implementing PBIS reduce disruptive behavior, reduce inequities in exclusionary discipline, and support the use of classroom management.2 One solution to the increasing referral trends we see would be to rely more heavily on implementing multi-tiered systems of support like PBIS. Instead, what we see is a decline in the number of schools implementing those PBIS data, systems, and practices in the United States.3
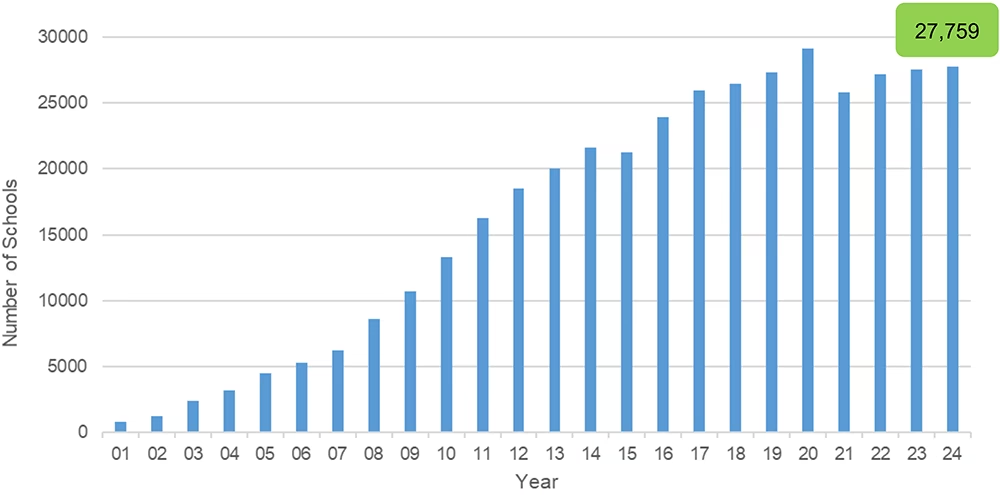
These two plot points — increasing referral trends and a decline in PBIS implementation —seem pretty darn related. But wait, our story continues...
The number of schools implementing PBIS isn’t zero. In fact, there are close to 28,000 schools implementing PBIS in the United States. That’s a lot of schools! To know more about what their implementation looks like, we turn once again to our favorite fidelity assessment: the Tiered Fidelity Inventory (TFI).
Using the TFI, PBIS teams evaluate the fidelity of their implementation across one, two, or all three tiers to answer the question: Are we doing what we said we would do? Because the survey is flexible, schools only need to assess the tiers they implement. I wondered just how many tiers these schools seem to be implementing. Of the TFIs submitted through PBIS Assessment, the number of schools measuring fidelity at each tier were:
- Tier 1: 13,494 schools
- Tier 2: 8,917 schools
- Tier 3: 6,205 schools
We expect schools to start their PBIS implementation by focusing on foundational Tier 1 elements. However, PBIS implementation doesn’t stop at defining expectations, acknowledging student behavior, and checking on referral data. Eventually, it’s time to step up those efforts and establish a new tier of support: Tier 2. With behavior rates increasing, it would seem more schools ought to be implementing and assessing their Tier 2 implementation.
What is Tier 2 Support
Tier 2 supports are the systems, data, and practices you implement to help students who are unsuccessful with Tier 1 support alone. It’s the tier where you have the opportunity to prevent more intense behaviors from happening before they ever become an issue. The things you do at Tier 2 are efficient, continuously available, and require very low effort from teachers to implement. Because of that, Tier 2 support often takes a group-based approach with 10 or more students participating together.
It’s important to remember: Students receiving Tier 2 support continue to receive all the same Tier 1 systems and practices as everyone else in the building. The difference is they’re given more opportunities to practice the schoolwide expectations they find challenging. Eventually, with enough practice, students may not need this additional level of support.
The same way data show us which students might benefit from these additional supports, data can also show us when Tier 2 interventions are successful and when we need to make a shift.
Defining Tier 2 Data
.png)
Every tier in PBIS comes with its own set of systems, practices, and data you’ll implement to achieve the outcomes you know are possible. The TFI tells us there are three core data features that are part of the Tier 2 supports you implement. If you’re looking to change the ending to your schoolwide data story, Tier 2 data and the way you use them to guide your decisions offer a compelling chapter. Here are the Tier 2 data elements to make sure you have in place.
Decision Making with Student Performance Data
For students enrolled in Tier 2 interventions, you need to collect data related to their progress. We call those data “outcome” data. Schools implementing Check-In Check-Out (CICO) will be familiar with the point card data collected as students check in with teachers throughout the day. [Shout out to our CICO-SWIS schools who have this data collection down!] These data help you know more about which students benefit from the supports they receive, which students might need to alter some part of their plan, and which students would benefit from more support than you currently offer. Examples of performance data could be:
- CICO Point Card Data
- Intervention Tracking Tool Scoring Criteria
- Daily/Weekly Progress Report Sheets
- Family communication
Beyond the data you collect, this feature specifically calls out the way your team regularly uses data to make decisions. Your team’s process should include a step for monitoring the collective success of an intervention as well as the individual success each student experiences. You’ll also need to document the decision rules your team follows (the how and when of your decisions) for intensifying the support, modifying it, or fading it.
Did you catch that critical verb in that last sentence? Document. Yeah, you need to write it down.
Decision Making with Fidelity Data
Students aren’t the only ones getting a performance review. Collecting fidelity data helps us know whether the adults are implementing the practices the way we hoped they would. There are lots of ways to collect these data:
- District technical assistance
- Fidelity probes taken monthly by Tier 2 team member
- Fidelity measures built into the intervention
- Annual or bi-annual fidelity assessments with the TFI
Just like with student outcome data, your Tier 2 team needs to regularly include fidelity data in the decisions it makes. Because fidelity checks happen less often, make sure your team has a schedule for those assessments for all Tier 2 interventions. Then, define the decision rules you’ll use to adjust the support you provide based on those evaluations. If we aren’t doing what we said we would do, and students aren’t as successful as we’d hoped they would be, our action plan should include an item to check in with adults and shore up their practices.
Creating an Evaluation Plan
Sharing the data you collect and the outcomes you’ve achieved with your larger schoolwide community is essential for sustaining your implementation. Every year, your team will put together an evaluation plan. Highlight the successes you achieved, the challenges you face, and the plans you have for continuing in the coming year. Effective evaluation plans link your Tier 2 supports with your larger school improvement efforts. Places to share your completed evaluation plan might be:
- School or district evaluation reports
- School newspapers
- School webpage
The national trend data make it clear: student behavior patterns have increased over the last three years. The impact you feel is real. While rising referral rates tell part of the story, they also point to an opportunity. Strengthening Tier 2 systems gives your school a way to respond early, support students efficiently, and prevent behaviors from escalating. When your team uses data to guide those efforts, you aren’t just tracking the story; you’re changing the ending.