


Anyone else feel like there is zero transition between September and October? I’m just finding my new school-year routine and then here comes October with its game schedules, picture days, assemblies, and open houses. September’s calendar of events was regimented, scheduled. October is a free-for-all and we’re all just hanging onto the steering wheel to make it to Halloween. (Oh no...Halloween!)
In times like this, I long for the easy button. Do you have one of those? I don’t...but if I did, that easy button would give me the answer to any question, solve any problem, or drive any child anywhere whenever I pressed it. I can’t do anything about an easy button for life, but maybe there’s something I can share to make your data decisions a little simpler: the easy button for data.
Data-driven decisions are part of every school’s PBIS implementation at every tier. According to The Center on PBIS data give us an objective way to assess how things are going. They also help us get students the support they need sooner to achieve the social and academic outcomes we know are possible. The trouble with data is there’s just way too much of it. Academics, attendance, grades, behavior, it’s A LOT. An easy button sure does sound good right about now.
Enter: decision rules.
Researchers are awesome partners when it comes to combing through big datasets. Not only to they LOVE data, but they LOVE looking for patterns. It’s in those patterns where decision rules emerge. A data-driven decision rule is a way to make a prediction about something that is currently unknown.1 It takes data that might feel overwhelming and says, “Here’s a place to start.” Plus, decision rules can act like our own personal crystal ball, guiding us toward a different future from the one once predicted.
If your team doesn’t have its own set of decision rules, we wanted to offer you some of our favorites. Here are just four of the decision rules we love related to student behavior.
Rule: A Precise Problem Statement is Likely Your Strongest VDP
For this rule you need to know two things:
- A precise problem statement (PPS) is a way to describe the specific situation generating the most referrals in your building. For a statement to be precise, it must answer the big W questions: Who, What, When, Where, and Why.
- A vulnerable decision point (VDP) is a “contextual event or element of the immediate situation that increases the likelihood of bias affecting discipline decision making.”2 When we make ambiguous decisions when we’re hungry, tired, or stressed, those decisions often contribute to greater inequities in our discipline outcomes.
In his review of 2018-19 SWIS referral data, our colleague and two-time Expert Instruction podcast guest, Sean Austin, found the precise problem statement and the strongest VDP were the same thing for 63% of the schools included in the dataset.3
When you use the SWIS Drill Down Tool to come up with your school’s PPS, view those same data through an equity lens. With all of your Drill Down filters in place, generate the Referral Risk Ratio graph and see how you refer groups of students in that context.
Rule: The October Catch
This one is an oldie, but a goodie. Data can help you identify which students might benefit from additional support. Research tells us October is a great time to use those data. We call this decision rule The October Catch. Here’s how it works.
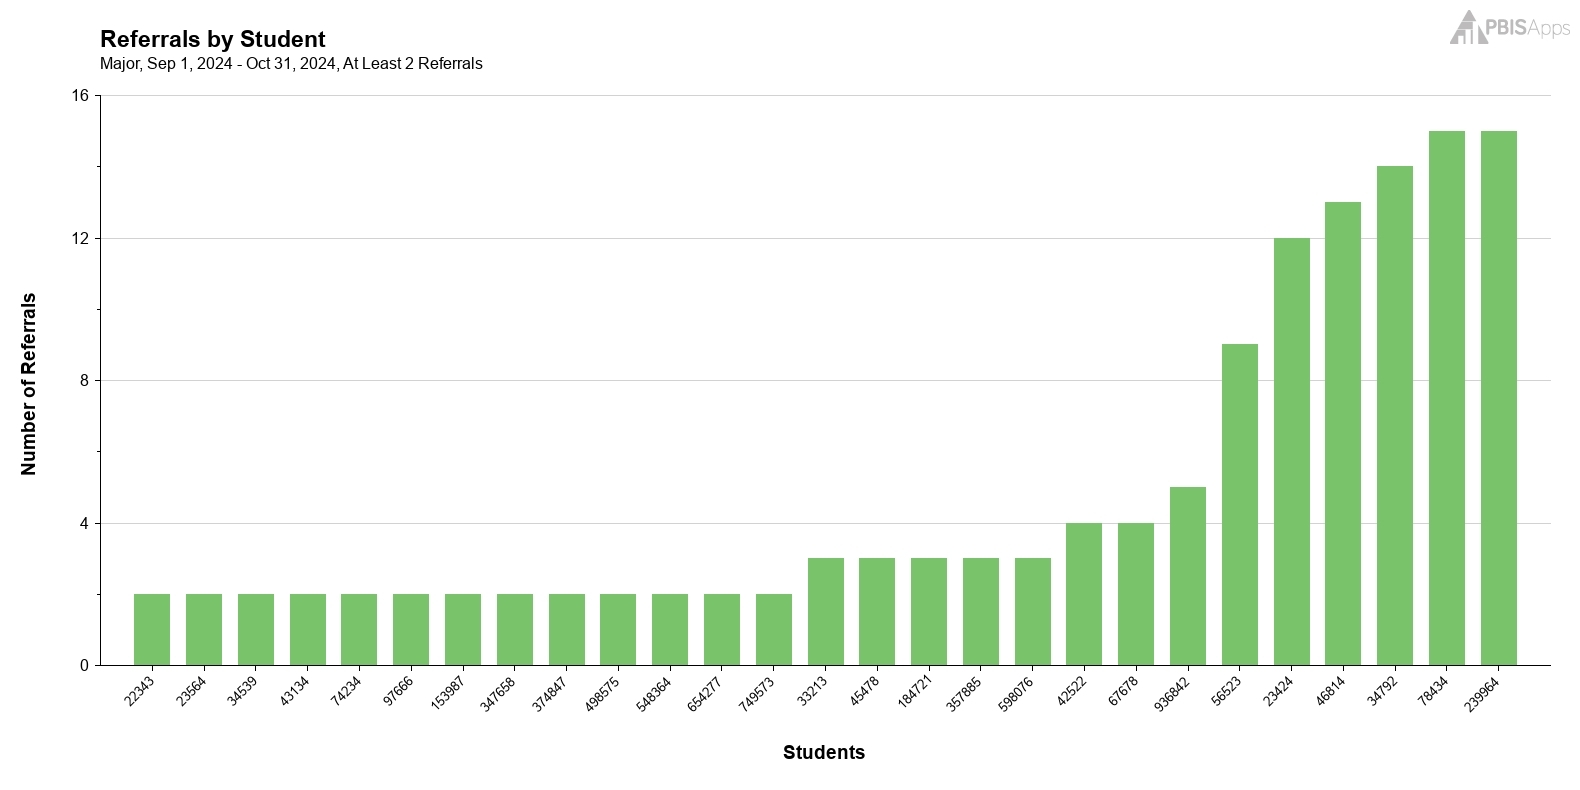
Researchers examined 581,775 referrals across 2500 elementary schools.4 They wanted to see how many referrals each student accumulated by the end of the year, and whether there was a time early on to intervene and change that trajectory. For elementary schoolers, 50% of students who received 6 or more total referrals over the whole year already had 2 or more referrals by the end of October; 79% had 2 or more referrals by the end of December. That means, right now you have the ability to identify some students for additional support well before they have the time to accumulate 4, 5, 6 or more referrals. As you generate the SWIS Referrals by Student report this October, pay close attention to the students in your building with 2 or more referrals.
- What you know about each student?
- Do you have additional screening data available to you?
- What are the targeted supports available in your building?
- Which of the students in this report would benefit from enrollment in a targeted intervention?
Rule: September/November Catch
The October Catch focused on referral patterns in elementary schools. What about middle schools? They get a decision rule too!
In another study, researchers examined 403,172 referrals across almost 600 middle schools to answer the same question: When is the earliest time we can intervene and change the trajectory for students who might benefit from additional support? While October and November are still good times to look for students with two or more referrals, there’s an even better predictor at the middle school level. For middle school students who receive six or more referrals by the end of the year, 91% had at least one referral in September for defiance.5
If you’re a middle school team, this gives you a few data points this fall to help you identify students who could benefit from additional support.
- Generate the Referrals by Student Report and look for students with two or more referrals by the end of October.
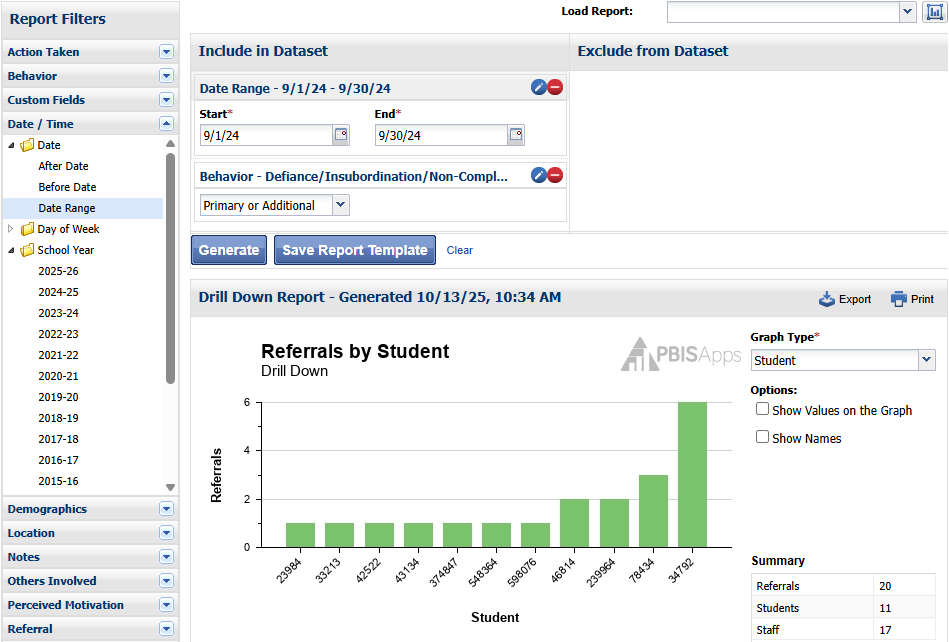
- Head to the Drill Down Tool. Add September 1-30 of the current school year as a date range and then add defiance as your filters. Generate the Referrals by Student Report. Any student with at least one referral for defiance in September is a student you should consider.
Once you have a list, take a look at the targeted interventions you offer at your school.
- Could you start any of the students on your list on one of these interventions?
- Is there any additional screening you’d like to use to better support one of these students?
- Have you checked in with their teachers to find out what they think would be helpful?
Rule: 10 students vs 10%
Sometimes rules are backed by research; sometimes rules get passed down as lore. No one knows exactly where they came from, but they remain rooted in your team’s decision-making process. Enter the 10 students/10% rule. No one in our office can point to any research behind it [if you can find it, maybe you’ll win a special prize]. All we know is that the idea behind the rule is sound. Here’s how it works.
Let’s say your school has 500 students enrolled. Now, put yourself on that school’s team and imagine solving a problem where 10 students are involved versus 50 students (10%). The 10 students/10% rule helps you decide which type of solution to implement:
- “10 students”: Group-based solution
- “10%”: System-based solution
Now, with this rule, we don’t literally mean 10 students or 10%. The numbers serve as reminders: do we have a small group of students or a whole lot of students contributing to the issue we’re trying to solve? If we go back to our 500-student example, let’s say our team used the Drill Down Tool to come up with a precise problem statement. We flip the graph type to Student and see the following:
Graph 1
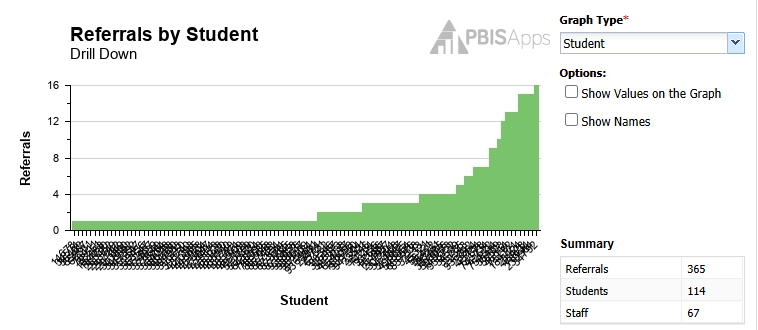
The fact that we can’t read those student id numbers means we have a lot of students. When you have a lot of students, that’s a “10%” decision; it’s time to look at system-level solutions like reteaching expectations, setting up a schoolwide incentive to promote an alternative behavior, or changing something about schoolwide procedures.
Now, what if the Referrals by Student Report looked like this?
Graph 2
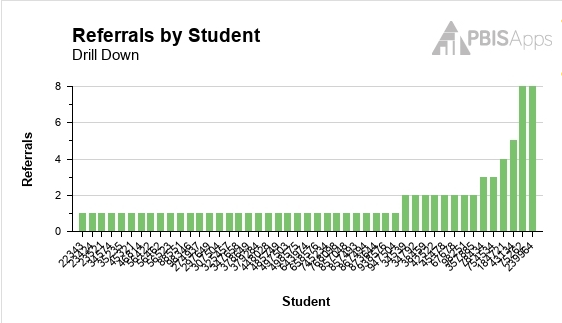
If this still seems like a big group, what if I told you more than half of these students were in 3rd grade? Sounds like a small group to me. In this scenario, our solution shifts to a “10 students” or targeted approach focused on 3rd grade classrooms.
While we may never find an easy button for life, decision rules come pretty close when it comes to making sense of your data. They simplify the chaos, focus your attention, and give you a clear place to start. This month, as October speeds by, take a moment to test out these rules. You might just find the clearer your decisions become, the easier the work feels.
Want to dive a little deeper into some of these decision rules? Let’s keep the conversation going. We’ve got two free events in the books for you to attend!
- October 17, 10:00-11:00 PDT: The PBISApps Community digs into the research and use cases for The October catch. Sign up for this virtual event today!
- October 29, 11:00-12:00 PDT: Join our free, online training to learn more about examining behavior, attendance, and intervention data to surface early warning signs to get students support sooner. Register now!
1. Shedden, K. (2021). The Introduction to Data Science [e-book edition]. https://dept.stat.lsa.umich.edu/~kshedden/introds/topics/about/
2. McIntosh, K., Girvan, E., Horner, R., & Smolkowski, K. (2014). Education not incarceration: A conceptual model for reducing racial and ethnic disproportionality in school discipline. Journal of Applied Research on Children: Informing Policy for Children at Risk, 5(2).
3. Austin,S. C. (2022). National Patterns of Vulnerable Decision Points in School Discipline (Doctoral dissertation, University of Oregon).
4. McIntosh, K., Frank, J., & Spaulding, S. A. (2010). Establishing research-based trajectories of office discipline referrals for individual students. School Psychology Review, 39, 380-394.
5. Predy, L., McIntosh, K., & Frank, J. (2014). Utility of number and type of office discipline referrals in predicting chronic problem behavior in middle schools. School Psychology Review, 43(4), 472-489.